

Thermo Fisher Scientific Inc Stock (TMO) Moved Up by 3.15% on Mar 24: Facts Behind the Movement
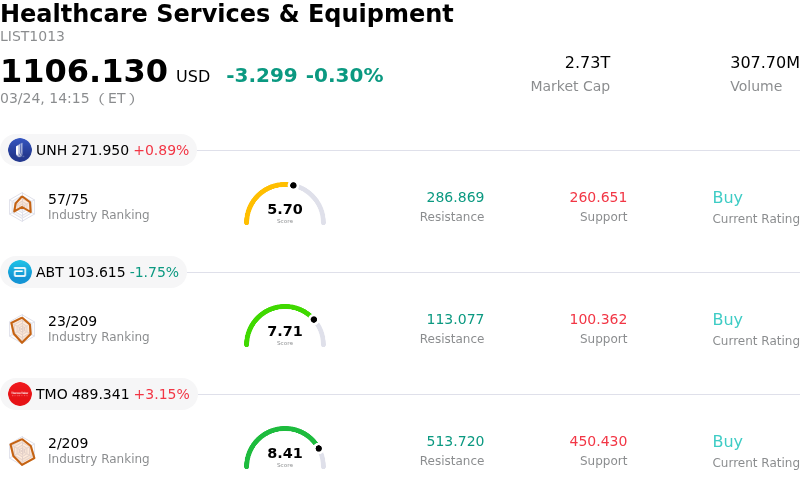
Thermo Fisher Scientific Inc (TMO) moved up by 3.15%. The Healthcare Services & Equipment sector is down by 0.30%. The company outperformed the industry. Top 3 stocks by turnover in the sector: Unitedhealth Group Inc (UNH) up 0.89%; Abbott Laboratories (ABT) down 1.75%; Thermo Fisher Scientific Inc (TMO) up 3.15%.
What is driving Thermo Fisher Scientific Inc (TMO)’s stock price up today?
Thermo Fisher Scientific's stock experienced upward movement today, primarily driven by the completion of its strategic acquisition of Clario Holdings, Inc.. This acquisition is a significant development, expanding Thermo Fisher's capabilities within the clinical research landscape.
Clario, a prominent provider of endpoint data solutions for clinical trials, will be integrated into Thermo Fisher’s Laboratory Products and Biopharma Services segment. This move is expected to enhance Thermo Fisher's ability to offer comprehensive digital solutions for collecting, managing, and analyzing clinical trial data, thereby strengthening its partnership with pharmaceutical and biotech clients. The acquired platform has a track record of supporting a substantial percentage of novel drug approvals by regulatory bodies over the past decade, indicating its established value in the drug development process.
From a financial perspective, the acquisition is anticipated to be immediately beneficial to Thermo Fisher's adjusted operating margin and contribute positively to its adjusted earnings per share in the first year. Management expects the acquired business to exhibit strong growth and margin profiles, with projections for significant adjusted operating income from synergies within five years post-acquisition.
This positive company-specific news aligns with a generally favorable outlook from analysts, who largely maintain "Buy" ratings and project continued growth for Thermo Fisher Scientific. Furthermore, the broader life sciences industry is anticipated to see a rebound in profits, with companies like Thermo Fisher well-positioned to benefit from increased demand for life science tools and services in the coming years. The company's recent strong fourth-quarter earnings and increased dividend also contribute to a robust financial backdrop.
Technical Analysis of Thermo Fisher Scientific Inc (TMO)
Technically, Thermo Fisher Scientific Inc (TMO) shows a MACD (12,26,9) value of [-19.35], indicating a neutral signal. The RSI at 36.87 suggests neutral condition and the Williams %R at -68.22 suggests oversold condition. Please monitor closely.
Fundamental Analysis of Thermo Fisher Scientific Inc (TMO)
Thermo Fisher Scientific Inc (TMO) is in the Healthcare Services & Equipment industry. Its latest annual revenue is $44.56B, ranking 2 in the industry. The net profit is $6.70B, ranking 1 in the industry. Company Profile
Over the past month, multiple analysts have rated the company as Buy, with an average price target of $662.47, a high of $750.00, and a low of $595.00.
More details about Thermo Fisher Scientific Inc (TMO)
Company Specific Risks:
- Elevated implied volatility indicates increased uncertainty, with the options market currently signaling 44.0% annualized volatility for Thermo Fisher Scientific, which is high compared to most large-cap equities.
- The company's Sharpe ratio of -0.19 suggests that its stock volatility has not been compensated by positive excess returns, highlighting unrewarded risk for investors.
- Thermo Fisher Scientific's stock has experienced significant underperformance, declining by 9.84% over the past year, in stark contrast to the S&P 500's 16.41% gain during the same period.
- Technical analysis reveals mixed to mildly bearish signals across several indicators, with the company reportedly not operating at full potential according to monthly moving averages, suggesting underlying operational weaknesses.
Nothing in this material constitutes investment advice, personal recommendation, investment research, an offer, or a solicitation to buy or sell any financial instrument. The content has been prepared without consideration of your individual investment objectives, financial situation, or needs, and should not be treated as such.
Past performance is not a reliable indicator of future performance and/or results. Forward-looking scenarios or forecasts are not a guarantee of future performance. Actual results may differ materially from those anticipated.
Mitrade makes no representation or warranty as to the accuracy or completeness of the information provided and accepts no liability for any loss arising from reliance on such information.
Recommended Articles


