

Crypto Majors Stall as Bitcoin, Ether, and XRP Struggle to Shake Off Bearish Overhang


Post-Correction Pause: Top cryptocurrencies are consolidating after a brutal week that saw Bitcoin, Ethereum, and XRP shed nearly 9%, 8%, and 10% respectively.
Technical Ceilings: Upside momentum remains capped, with Bitcoin facing stiff resistance near $73,000 and Ethereum rejecting off a critical Fibonacci level.
Bearish Signals: Despite oversold RSI readings hinting at a relief bounce, MACD crossovers across the board suggest the broader downtrend remains intact.
The cryptocurrency market opened the week in a tentative holding pattern, with major assets consolidating losses following a sharp correction. After a punishing week where Bitcoin (BTC), Ethereum (ETH), and Ripple (XRP) surrendered nearly 9%, 8%, and 10% of their value respectively, bulls are struggling to mount a convincing recovery.
While prices have stabilized, the technical structure suggests caution. The broader trend remains weighted to the downside, with rallies facing immediate rejection at key structural levels.
Bitcoin: The $70k PivotBitcoin has managed to find a tenuous floor, steadying around the $70,000 handle on Monday. This follows a volatile week where the asset tumbled nearly 10% to tap a low of $60,000 on Friday before snapping back to retest daily resistance at $73,072 on Sunday.
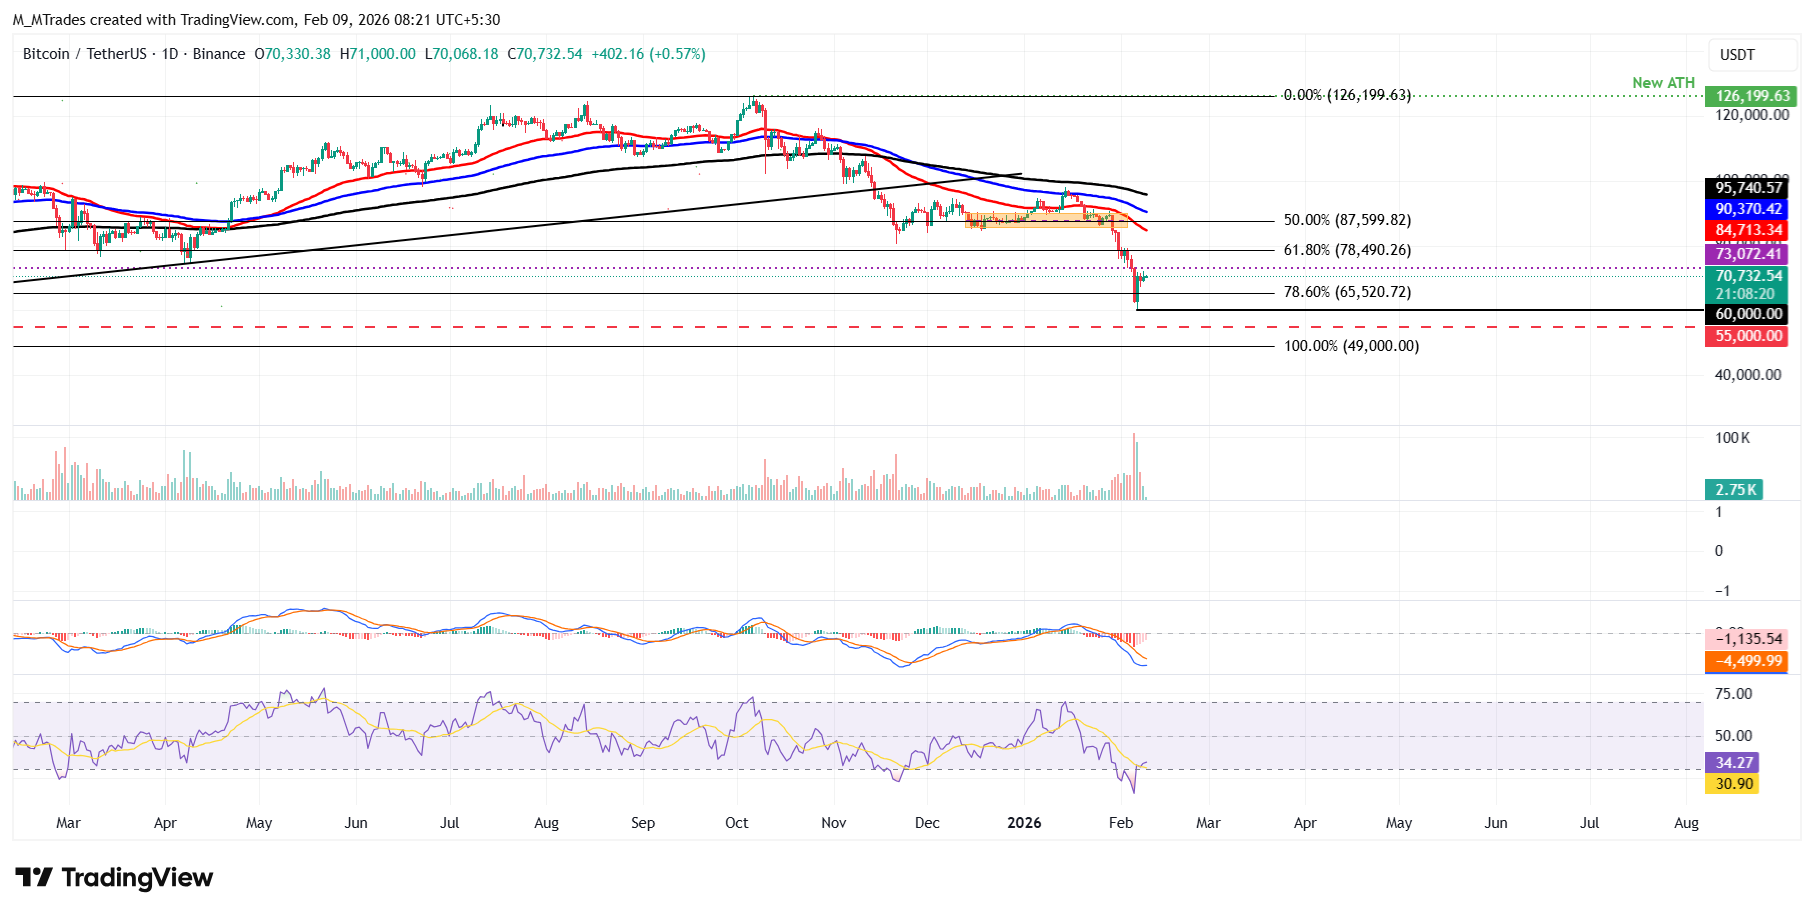
At the time of writing, BTC is changing hands near $70,700, trapped between support and resistance.
The Bull Case: A sustained break above the current consolidation could see price extend its advance to challenge the daily resistance at $73,072. The Relative Strength Index (RSI) on the daily chart stands at 34, angling upward from oversold territory—a classic signal of fading bearish momentum that often precedes a relief rally.
The Bear Case: However, momentum indicators are conflicted. The Moving Average Convergence Divergence (MACD) has printed a bearish crossover, pointing to trend continuation. If sellers regain control, BTC risks sliding toward $65,520—the 78.6% Fibonacci retracement level drawn from the August 2024 low of $49,000 to the October 2025 all-time high of $126,199.
Ethereum: Capped by Fibonacci ResistanceEther remains under heavy pressure, facing a clean rejection at the 78.6% Fibonacci retracement level around $2,149. The second-largest crypto corrected over 8% last week, flushing to a low of $1,747 on Friday—levels not seen since May 6, 2025.
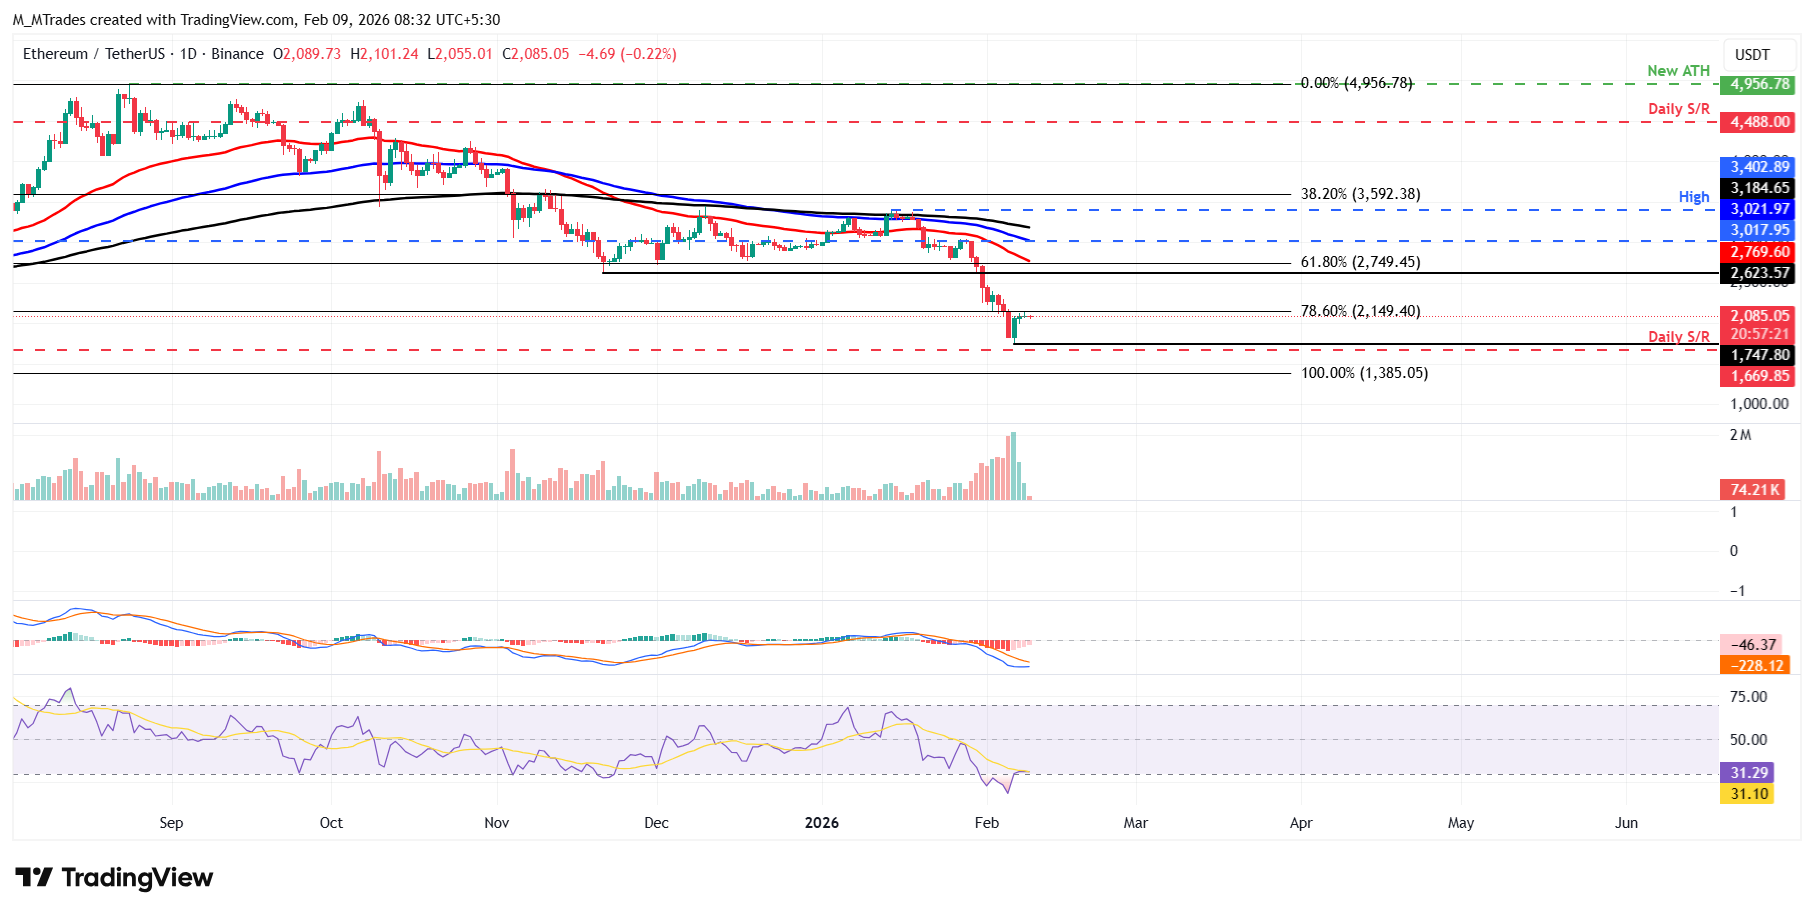
Although price recovered through Sunday to tag $2,149, it has failed to reclaim higher ground.
Technical Outlook: The daily RSI reads 31, hovering just above oversold territory, confirming that bears control the momentum. Like Bitcoin, the MACD shows an intact bearish crossover.
Key Levels: Unless ETH can break and close above $2,149 to target the next resistance at $2,500, the path of least resistance appears lower. A continuation of the downtrend would likely see a retest of Friday’s lows at $1,747.
XRP: Bearish Retest of the WedgeXRP is exhibiting a classic "break-and-retest" pattern. After slicing through the lower trendline of a falling wedge pattern on Thursday and hitting a low of $1.11 on Friday, price has pulled back to test the breakdown level.
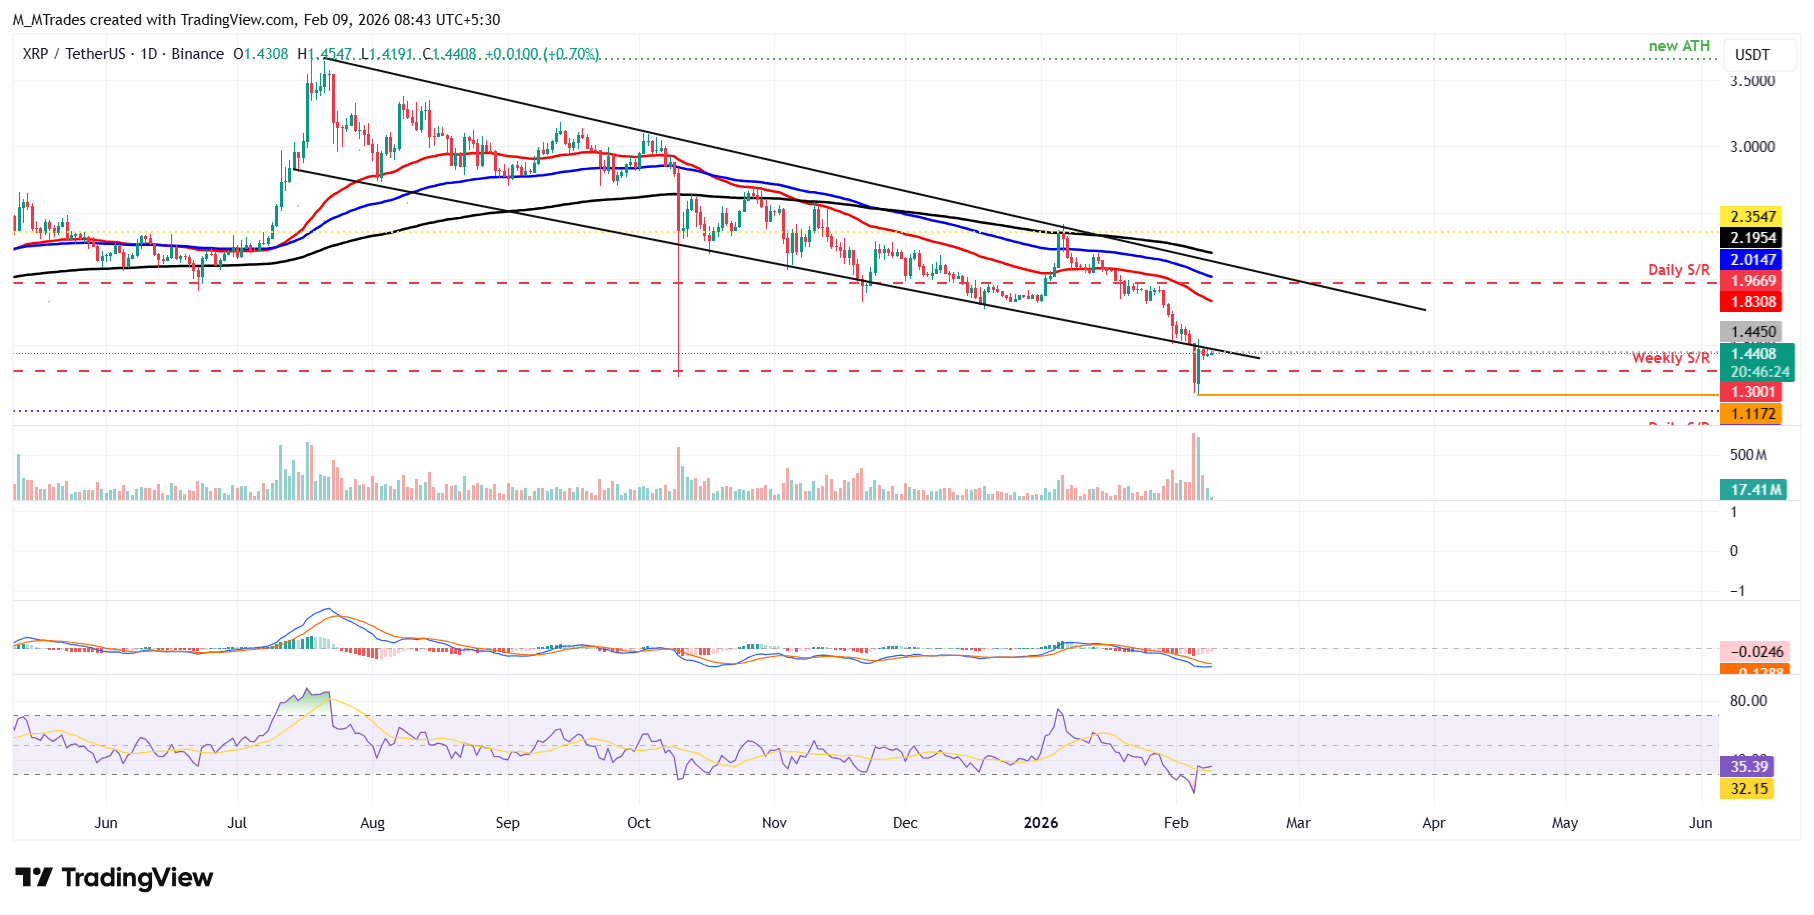
Currently trading around $1.44, XRP is hovering right at this broken boundary, which has now flipped from support to resistance—a setup that often indicates trader caution.
Scenario Analysis: If the breakdown is confirmed and the downtrend resumes, XRP could extend its decline toward weekly support at $1.30. Momentum indicators (RSI and MACD) mirror the negative outlook seen in ETH.
Upside Target: Conversely, if bulls can engineer a false breakout and close back above the pattern’s lower boundary, a rally toward the 50-day Exponential Moving Average (EMA) at $1.83 could be on the cards.
Disclaimer: The content available on Mitrade Insights is provided for informational and marketing purposes only. It has not been prepared in accordance with legal requirements designed to promote the independence of investment research and is not subject to any prohibition on dealing ahead of the dissemination of investment research.
Nothing in this material constitutes investment advice, personal recommendation, investment research, an offer, or a solicitation to buy or sell any financial instrument. The content has been prepared without consideration of your individual investment objectives, financial situation, or needs, and should not be treated as such.
Past performance is not a reliable indicator of future performance and/or results. Forward-looking scenarios or forecasts are not a guarantee of future performance. Actual results may differ materially from those anticipated.
Mitrade makes no representation or warranty as to the accuracy or completeness of the information provided and accepts no liability for any loss arising from reliance on such information.


