



Crypto Overview: Bitcoin holds at $74,000 amid Trump's good deal comment – RaveDAO, Polkadot, Ethena lead gains
- Bitcoin extends losses below $75,000 on Friday as the broader cryptocurrency market steadies.
- The total market liquidations exceed $400 million in 24 hours, signaling a rise in volatility.
- RaveDAO, Polkadot, and Ethena extend gains over the last 24 hours.
The broader cryptocurrency market steadies as US President Donald Trump hints that the ceasefire is “going to be a good deal.” Bitcoin (BTC) holds above $74,000 at press time on Friday, while the total market liquidations exceed $400 million, signaling increased volatility. Meanwhile, RaveDAO (DAO), Polkadot (DOT), and Ethena (ENA) are leading gains over the last 24 hours.
Liquidations surge amid extending ceasefire talks
Donald Trump hints at an extension of the two-week truce with Iran while both block the Strait of Hormuz. Trump, in an interview at the White House, said, “It’s looking very good that we’re going to make a deal with Iran, and it’s going to be a good deal.”
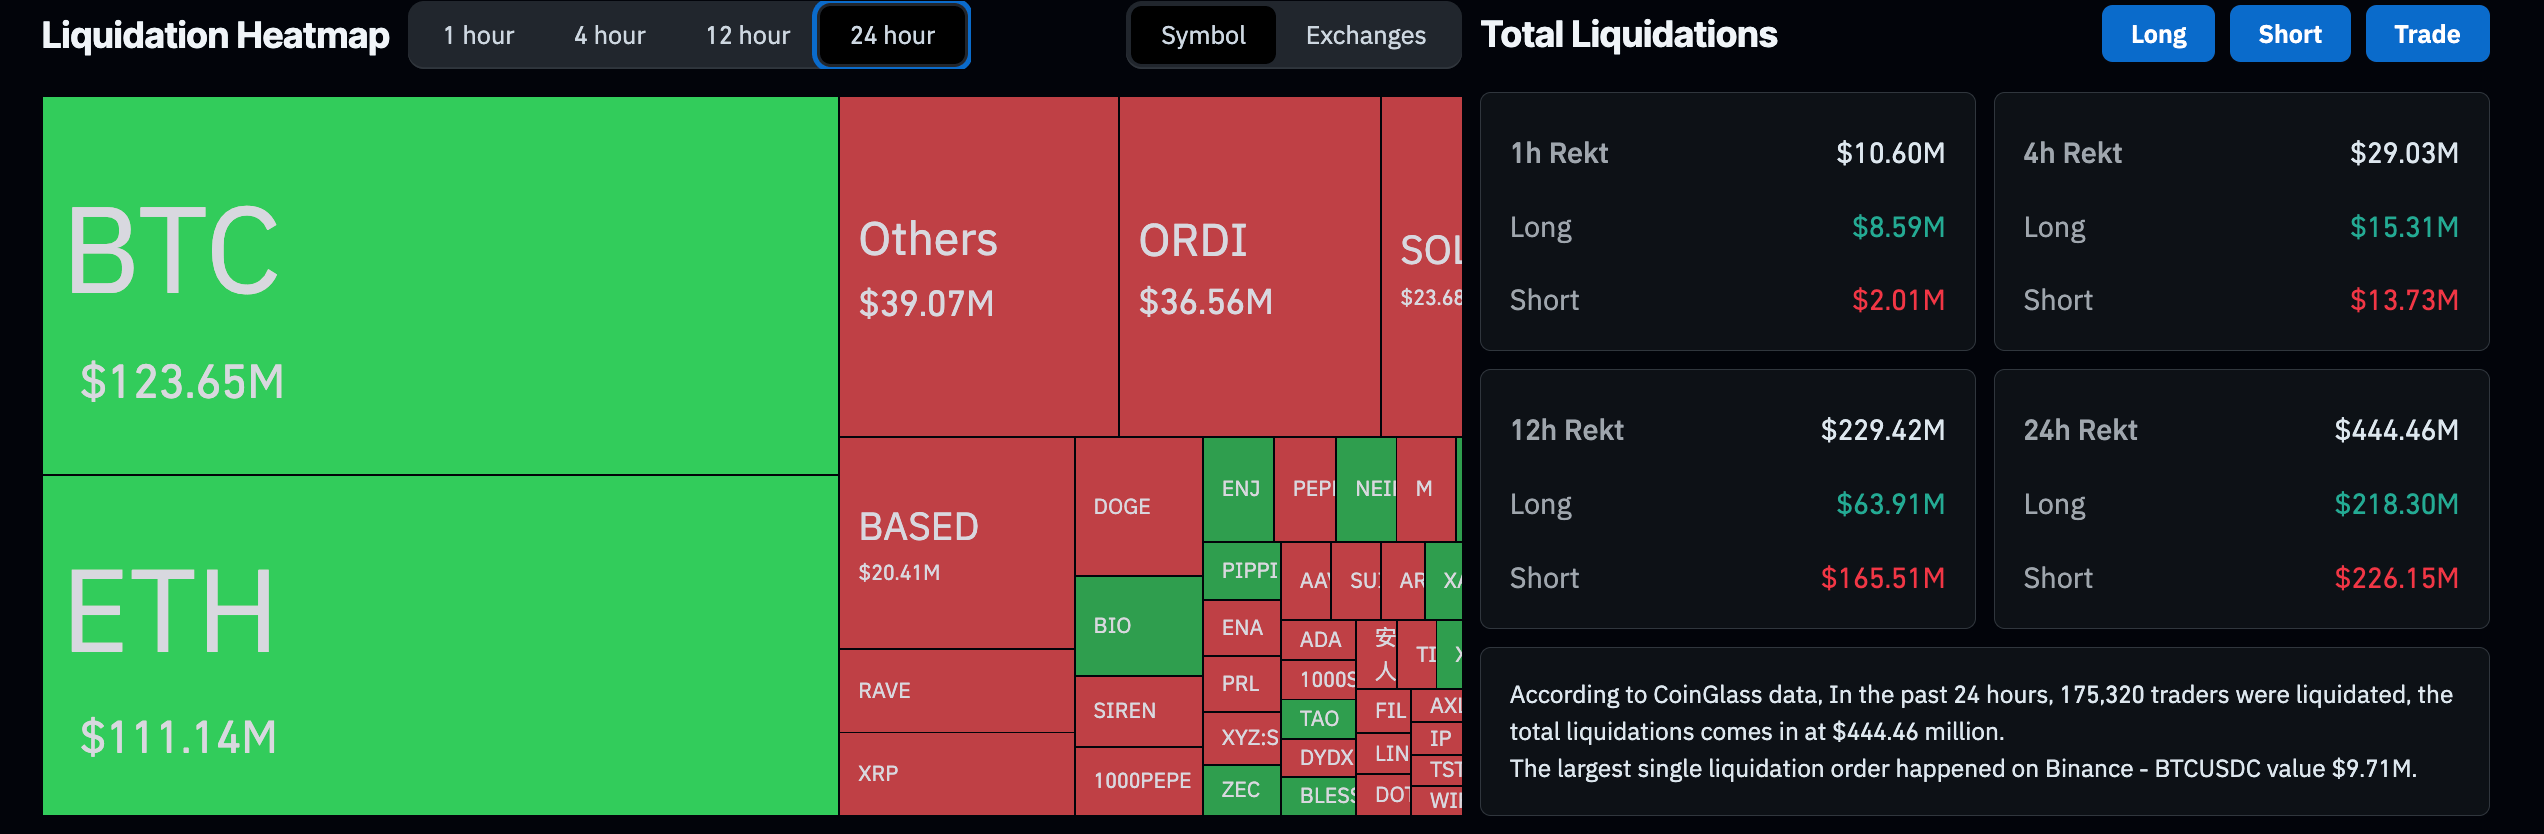
Meanwhile, the cryptocurrency market recorded $444 million in liquidations over the last 24 hours, led by $226 million in short liquidations and $218 million in long liquidations. The nearly equal long and short liquidations indicate heightened volatility across the market as prices whipsaw.
Still, the broader market sentiment remains neutral after the start of the US-Iran truce talks.
Technical outlook: Could RaveDAO, Polkadot, and Ethena extend gains?
RAVE trades above $17 at press time on Friday, extending a steep bullish phase far above its underlying trend metrics. The pair holds decisively over both the 50-day Exponential Moving Average (EMA) at $3.1171 and the 100-day EMA at $1.8174, underscoring a strongly supported uptrend despite the vertical nature of the latest advance.
Momentum remains stretched, with the Relative Strength Index (RSI) hovering deep in overbought territory at 78, while the Moving Average Convergence Divergence (MACD) stays firmly positive, which together suggest the rally’s impulse is strong but increasingly vulnerable to sharp corrective swings.
With no nearby chart-based resistance levels, RAVE remains in a price discovery mode.
On the downside, the first meaningful structural cushion emerges well below spot at the 50-day EMA around $3.12, followed by the 100-day EMA near $1.82, where dip-buying interest would be expected to reappear if a deeper retracement unfolds.
Polkadot holds above $1 at the time of writing on Friday, in a broadly bearish setup below the 50-day, 100-day and 200-day EMAs, which continue to cap the upside and frame a dominant downtrend structure.
That said, MACD has turned positive after crossing above the signal line and is edging higher, while the RSI at 50 hovers around the midline, hinting that bearish pressure is losing momentum even as the broader trend remains under strain.
On the topside, initial resistance is aligned with the 50-day EMA around $1.37, where sellers could re-emerge on any bounce. A break above this level would expose the next resistance at the 100-day EMA near $1.58, ahead of a more strategic barrier at the 200-day EMA around $2.05.
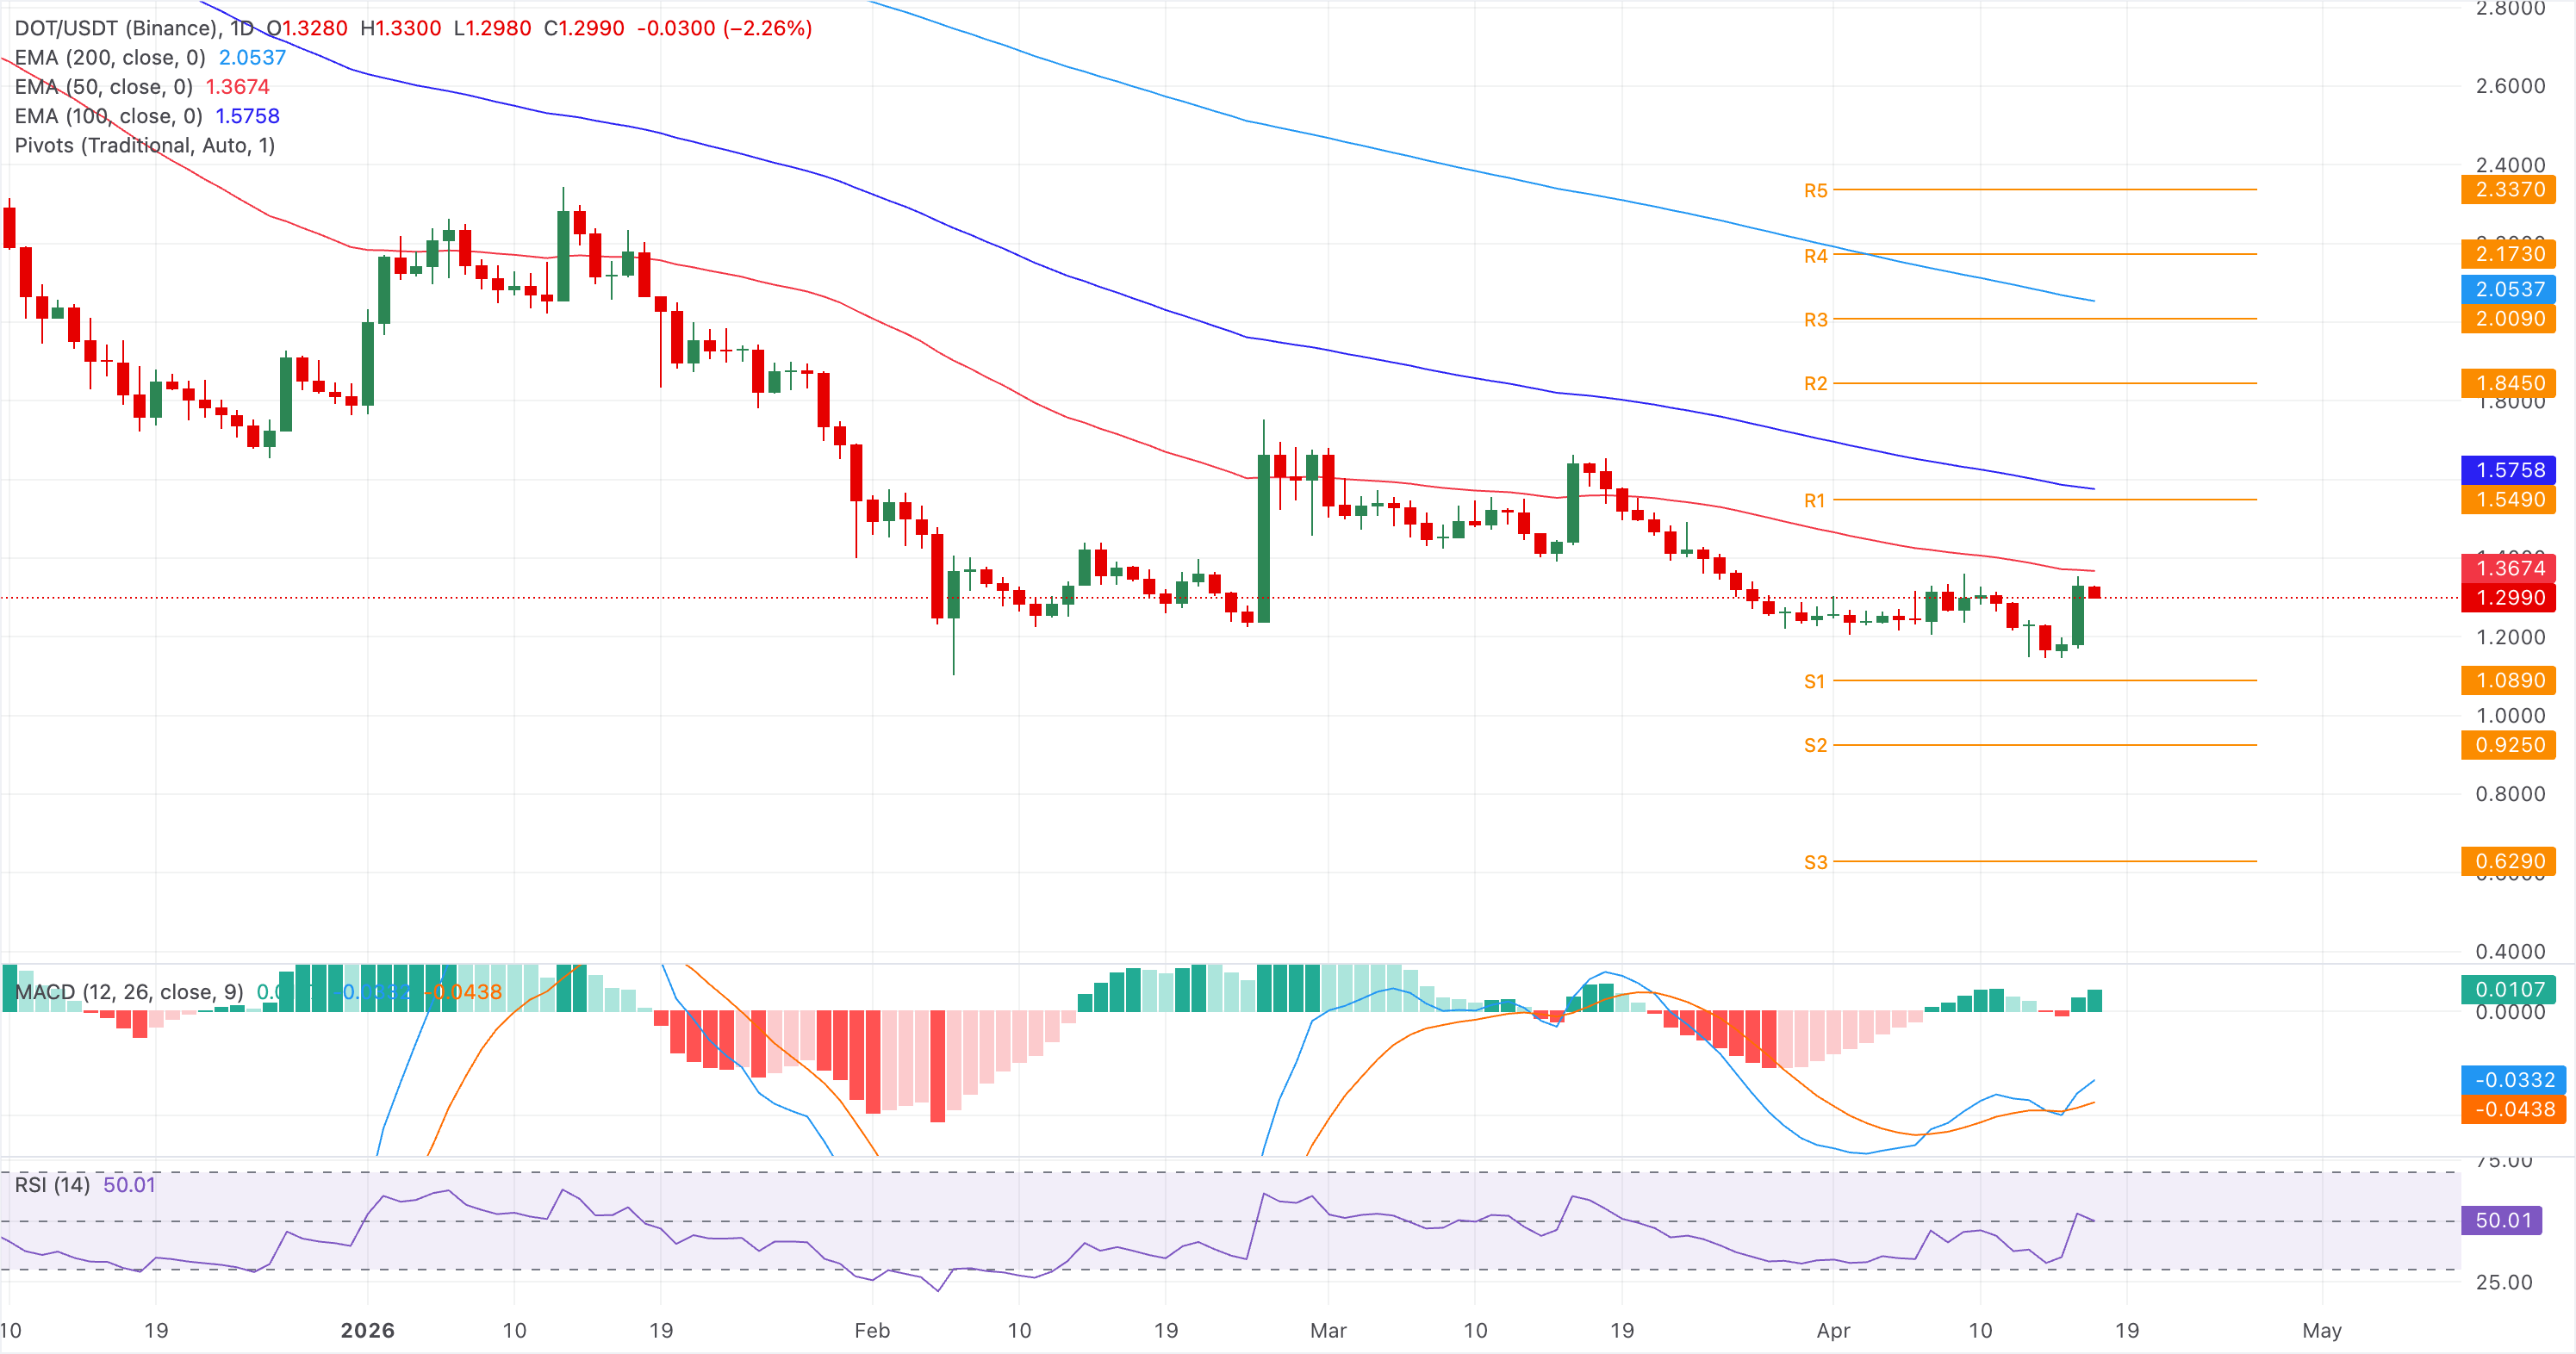
Looking down, the S1 Pivot Point remains a key support at $1.08.
Finally, Ethena shows a steady recovery, surpassing the 50-day EMA at $0.1041, which now offers initial dynamic support. Still, ENA remains well below the 100-day and 200-day EMAs at $0.1382 and $0.2109, keeping the broader bias bearish despite the latest bounce.
Momentum is improving, with the RSI at 61 hovering just above the center line while the MACD line enters positive territory, suggesting that near-term upside attempts could continue but are likely to face overhead supply at the higher averages.
On the topside, initial resistance aligns with the 100-day EMA at $0.1382, and a daily close above this level would be needed to ease the prevailing bearish structure before the more distant 200-day EMA at $0.2109 comes into view.
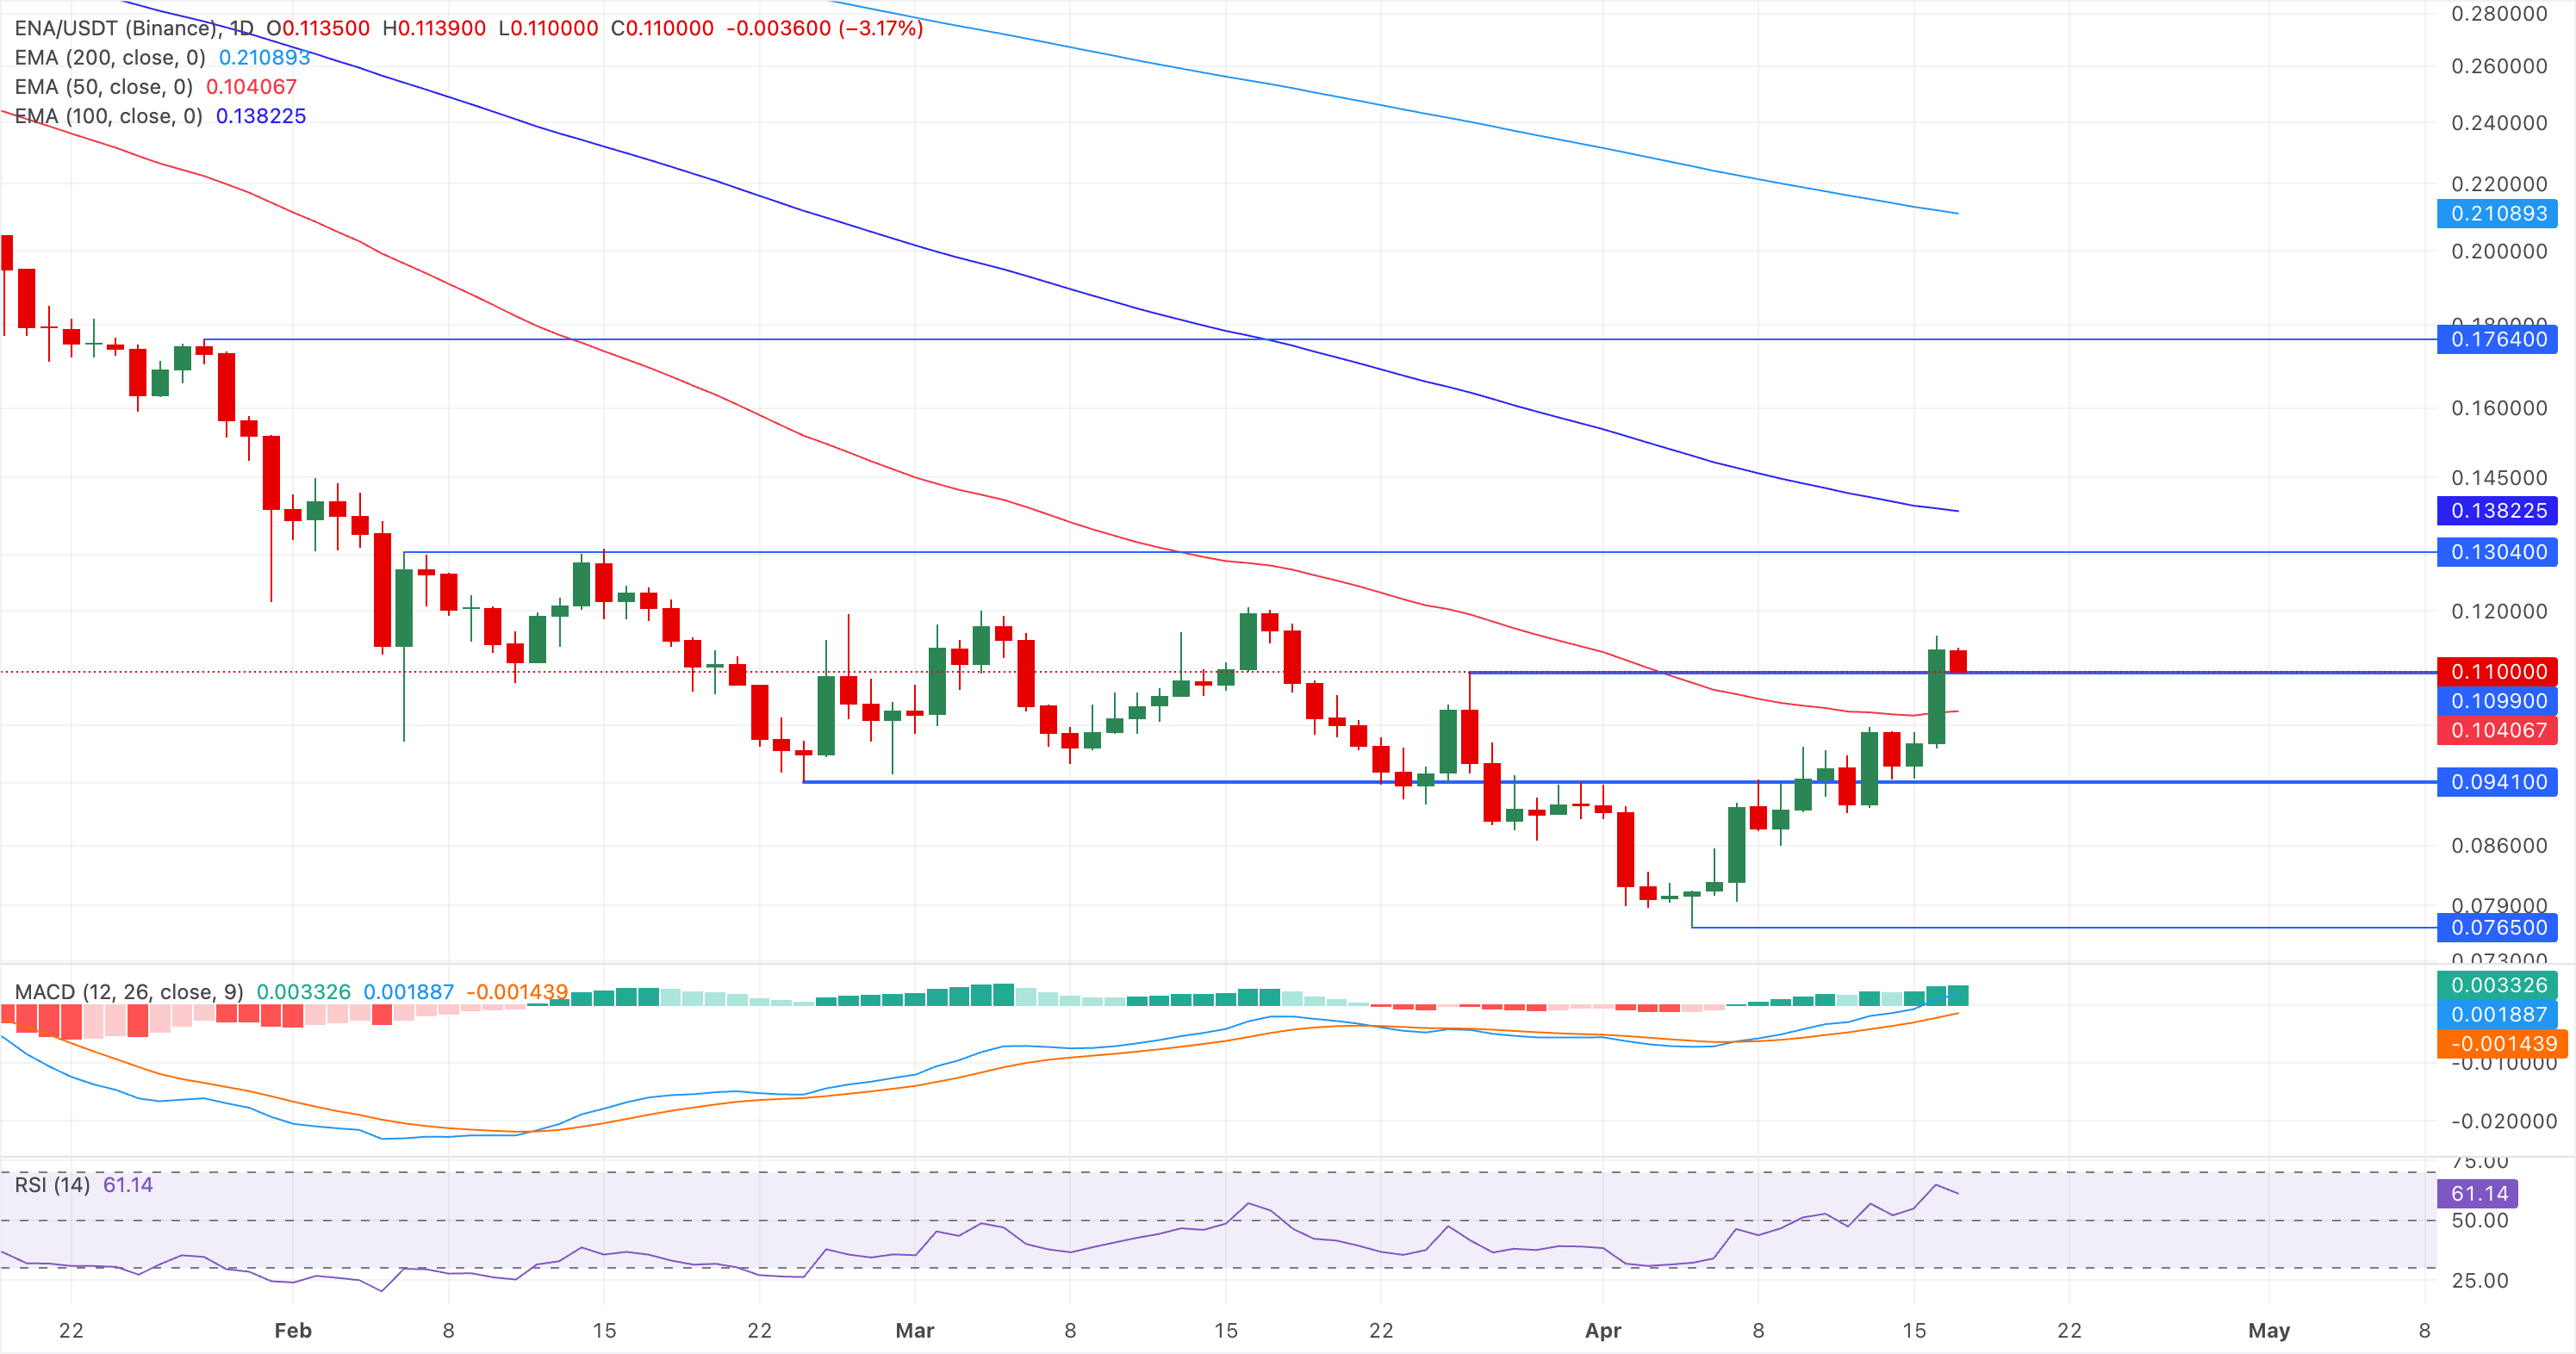
On the downside, immediate support is seen at the 50-day EMA around $0.1041; a break back below this floor would expose the recent swing area nearer the $0.10 handle and warn of a deeper pullback within the dominant downtrend.
(The technical analysis of this story was written with the help of an AI tool.)
Nothing in this material constitutes investment advice, personal recommendation, investment research, an offer, or a solicitation to buy or sell any financial instrument. The content has been prepared without consideration of your individual investment objectives, financial situation, or needs, and should not be treated as such.
Past performance is not a reliable indicator of future performance and/or results. Forward-looking scenarios or forecasts are not a guarantee of future performance. Actual results may differ materially from those anticipated.
Mitrade makes no representation or warranty as to the accuracy or completeness of the information provided and accepts no liability for any loss arising from reliance on such information.
Recommended Articles


