

T-Mobile US Inc Stock (TMUS) Moved Up by 3.00% on Apr 23: Key Drivers Unveiled
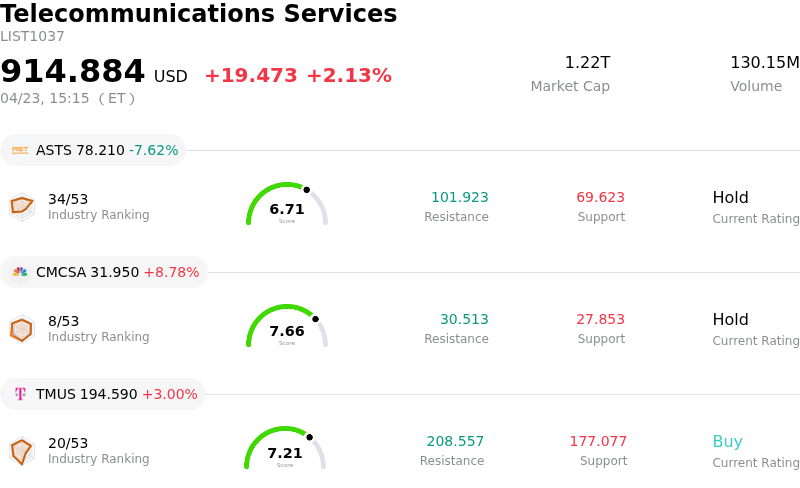
T-Mobile US Inc (TMUS) moved up by 3.00%. The Telecommunications Services sector is up by 2.13%. The company outperformed the industry. Top 3 stocks by turnover in the sector: AST SpaceMobile Inc (ASTS) down 7.62%; Comcast Corp (CMCSA) up 8.78%; T-Mobile US Inc (TMUS) up 3.00%.
What is driving T-Mobile US Inc (TMUS)’s stock price up today?
T-Mobile US experienced an upward movement on April 23, driven by a combination of positive analyst sentiment and anticipation ahead of its upcoming earnings report. The stock appeared to attract renewed investor interest as it showed signs of potentially being oversold, a condition often seen as a buying opportunity. This technical signal coincided with several recent upgrades and reiterated "Buy" ratings from various analysts, who maintained optimistic price targets for the company.
Further contributing to the positive momentum was a pre-earnings analysis suggesting that T-Mobile was well-positioned to exceed its quarterly earnings estimates. This optimism emerged despite a slight downward adjustment to the consensus earnings per share forecast in the preceding weeks. Investors may have been factoring in the company's historical performance of often surpassing analyst expectations.
Intraday volatility was likely influenced by ongoing speculation surrounding a potential full merger between T-Mobile US and its parent company, Deutsche Telekom. While initial reports of this complex, all-share transaction had introduced some uncertainty and concerns about regulatory hurdles, market participants may have been re-evaluating the strategic long-term benefits for T-Mobile, such as a strengthened market position and enhanced access to capital. The differing interpretations of this potential corporate restructuring could explain the significant fluctuations observed during the trading day.
Technical Analysis of T-Mobile US Inc (TMUS)
Technically, T-Mobile US Inc (TMUS) shows a MACD (12,26,9) value of [-4.09], indicating a sell signal. The RSI at 32.64 suggests neutral condition and the Williams %R at -81.52 suggests oversold condition. Please monitor closely.
Fundamental Analysis of T-Mobile US Inc (TMUS)
T-Mobile US Inc (TMUS) is in the Telecommunications Services industry. Its latest annual revenue is $88.31B, ranking 4 in the industry. The net profit is $10.99B, ranking 4 in the industry. Company Profile
Over the past month, multiple analysts have rated the company as Buy, with an average price target of $263.26, a high of $310.00, and a low of $223.00.
More details about T-Mobile US Inc (TMUS)
Company Specific Risks:
- Ongoing discussions of a full merger with Deutsche Telekom introduce significant regulatory and political hurdles, alongside potential shareholder dilution and a "conglomerate discount" for existing T-Mobile shareholders.
- Recent reductions in long-standing customer perks, including new fees for Apple TV "On Us" and restrictions on free in-flight Wi-Fi, risk increasing postpaid phone churn, which already rose to 0.93% last year.
- Significant insider selling totaling approximately $151.1 million over the past three months, with an absence of reported insider purchases, may signal a lack of confidence among company executives regarding future performance.
Nothing in this material constitutes investment advice, personal recommendation, investment research, an offer, or a solicitation to buy or sell any financial instrument. The content has been prepared without consideration of your individual investment objectives, financial situation, or needs, and should not be treated as such.
Past performance is not a reliable indicator of future performance and/or results. Forward-looking scenarios or forecasts are not a guarantee of future performance. Actual results may differ materially from those anticipated.
Mitrade makes no representation or warranty as to the accuracy or completeness of the information provided and accepts no liability for any loss arising from reliance on such information.
Recommended Articles


