

Vertiv Holdings Co Stock (VRT) Moved Up by 3.33% on Apr 23: Key Drivers Unveiled
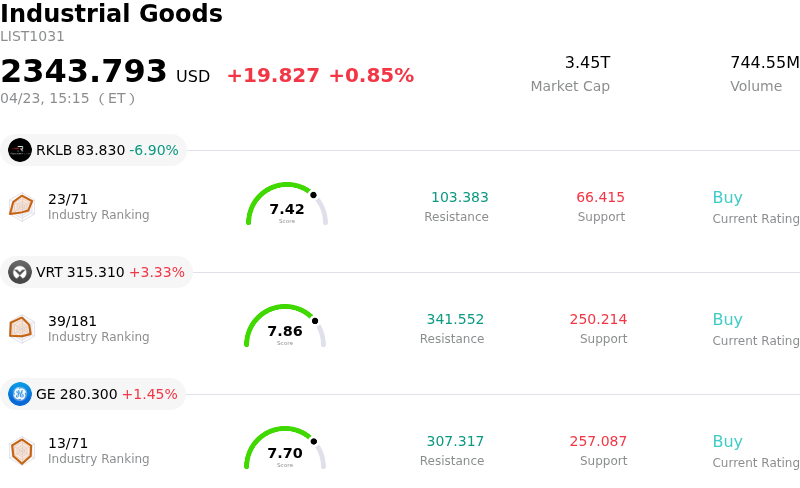
Vertiv Holdings Co (VRT) moved up by 3.33%. The Industrial Goods sector is up by 0.85%. The company outperformed the industry. Top 3 stocks by turnover in the sector: Rocket Lab USA Inc (RKLB) down 6.90%; Vertiv Holdings Co (VRT) up 3.33%; General Electric Co (GE) up 1.45%.
What is driving Vertiv Holdings Co (VRT)’s stock price up today?
Vertiv (VRT) experienced a positive movement in its share price today, accompanied by significant intraday volatility. This upward trend can primarily be attributed to the company's strong first-quarter 2026 financial results and an optimistic outlook for the remainder of the fiscal year, which were announced just prior to today's trading.
On April 22, 2026, Vertiv reported impressive first-quarter 2026 earnings, surpassing analyst expectations for both revenue and earnings per share. The company recorded a substantial increase in net sales compared to the same period last year, driven by robust organic sales growth, particularly within the Americas region. Furthermore, Vertiv announced a significant rise in its diluted and adjusted diluted earnings per share.
Following these strong financial disclosures, Vertiv raised its full-year 2026 guidance for net sales and non-GAAP earnings per share, indicating confidence in continued strong demand and operational performance. This upward revision of forecasts was notably above prior consensus estimates, which often acts as a significant catalyst for positive stock performance. The company's improved operating cash flow and adjusted free cash flow also contributed to the positive investor sentiment.
In response to the favorable earnings report and updated guidance, several prominent equity analysts reiterated positive ratings and increased their price targets for Vertiv. For instance, Morgan Stanley maintained an "Overweight" rating and raised its price target, citing a positive outlook driven by strong product offerings. UBS, Mizuho, Barclays, and TD Cowen similarly raised their price targets and maintained positive ratings, reflecting a consensus among financial experts regarding Vertiv's growth potential.
These developments underscore Vertiv's strategic position in the booming market for critical digital infrastructure, especially its role in supporting the escalating demand for artificial intelligence (AI)-driven data centers. The company has been actively expanding its capabilities through strategic acquisitions, such as BMarko Structures in mid-April, to enhance its capacity for scalable infrastructure solutions vital for AI data centers. A new distribution partnership in South America also aims to broaden its market reach for high-density data center solutions. These strategic moves, combined with outstanding financial performance and positive analyst sentiment, are key drivers behind the observed share price movement.
Technical Analysis of Vertiv Holdings Co (VRT)
Technically, Vertiv Holdings Co (VRT) shows a MACD (12,26,9) value of [13.25], indicating a buy signal. The RSI at 61.94 suggests neutral condition and the Williams %R at -23.82 suggests oversold condition. Please monitor closely.
Fundamental Analysis of Vertiv Holdings Co (VRT)
Vertiv Holdings Co (VRT) is in the Industrial Goods industry. Its latest annual revenue is $10.23B, ranking 17 in the industry. The net profit is $1.33B, ranking 13 in the industry. Company Profile
Over the past month, multiple analysts have rated the company as Buy, with an average price target of $287.05, a high of $350.00, and a low of $112.00.
More details about Vertiv Holdings Co (VRT)
Company Specific Risks:
- The stock is currently trading at a significant premium with a 74.9x P/E ratio, notably above its estimated DCF fair value of approximately $260.03, suggesting high future growth expectations may be priced in.
- Despite strong Q1 2026 earnings, the stock experienced an intraday decline, partly attributed to investor caution regarding potential "weakness overseas in Europe and Asia," which could impact future international revenue.
- The average analyst price target of $269.73 suggests a potential downside of 14.21% from the current stock price of $314.41, indicating that analysts, on average, view the stock as overvalued at present levels.
Nothing in this material constitutes investment advice, personal recommendation, investment research, an offer, or a solicitation to buy or sell any financial instrument. The content has been prepared without consideration of your individual investment objectives, financial situation, or needs, and should not be treated as such.
Past performance is not a reliable indicator of future performance and/or results. Forward-looking scenarios or forecasts are not a guarantee of future performance. Actual results may differ materially from those anticipated.
Mitrade makes no representation or warranty as to the accuracy or completeness of the information provided and accepts no liability for any loss arising from reliance on such information.
Recommended Articles


