


EUR/USD hovers near lows amid risk-off markets
- EUR/USD remains capped below 1.1800, with 1.1765 low at hand.
- The overall risk-averse sentiment and weak German Industrial data are weighing on the Euro.
- The ECB kept rates on hold and signalled a steady monetary policy on Thursday.
The Euro (EUR) ticks up against the US Dollar (USD) on Friday, trading near 1.1800 at the time of writing after hitting fresh two-week lows of 1.1765 earlier on the day. The sell-off in Equity markets has cast an overall risk-averse sentiment that is buoying the safe-haven Greenback, while German Industrial Production data has disappointed.
The US Dollar is drawing support from a global rout on Equities, with the tech sector leading losses amid growing market concerns about aggressive spending on Artificial Intelligence (AI). The risk-off mood has offset the impact of a string of downbeat US employment figures, which has increased pressure on the Federal Reserve (Fed) to provide further support to employment creation.
On Thursday, the European Central Bank (ECB) stood pat on interest rates, as widely expected, and dismissed concerns about Euro strength, pointing to a steady monetary policy for the foreseeable future.
Later on Friday, ECB Governing Council Member Martin Kocher will take the stage, while in the US session, the focus will be on the preliminary Michigan Consumer Sentiment Index. The crucial US Nonfarm Payrolls (NFP) report has been delayed for next week due to a partial government shutdown.
Euro Price Today
The table below shows the percentage change of Euro (EUR) against listed major currencies today. Euro was the strongest against the US Dollar.
| USD | EUR | GBP | JPY | CAD | AUD | NZD | CHF | |
|---|---|---|---|---|---|---|---|---|
| USD | -0.13% | -0.25% | -0.17% | -0.06% | -0.22% | -0.27% | -0.24% | |
| EUR | 0.13% | -0.12% | -0.04% | 0.08% | -0.08% | -0.13% | -0.10% | |
| GBP | 0.25% | 0.12% | 0.06% | 0.20% | 0.04% | -0.02% | 0.01% | |
| JPY | 0.17% | 0.04% | -0.06% | 0.15% | -0.02% | -0.08% | -0.04% | |
| CAD | 0.06% | -0.08% | -0.20% | -0.15% | -0.17% | -0.22% | -0.18% | |
| AUD | 0.22% | 0.08% | -0.04% | 0.02% | 0.17% | -0.05% | -0.02% | |
| NZD | 0.27% | 0.13% | 0.02% | 0.08% | 0.22% | 0.05% | 0.03% | |
| CHF | 0.24% | 0.10% | -0.01% | 0.04% | 0.18% | 0.02% | -0.03% |
The heat map shows percentage changes of major currencies against each other. The base currency is picked from the left column, while the quote currency is picked from the top row. For example, if you pick the Euro from the left column and move along the horizontal line to the US Dollar, the percentage change displayed in the box will represent EUR (base)/USD (quote).
Daily Digest market Movers: The US Dollar firms up in risk-off markets
- The main Wall Street indexes dropped for the third consecutive day on Thursday, dragged down by a sell-off in tech stocks as quarterly earnings boosted investors' concerns about an AI bubble.
- The US Dollar is trading higher against its main currency peers since US President Donald Trump selected former Fed Governor Kevin Warsh as the replacement of Jerome Powell as Fed Chairman. The market views Warsh as someone who will defend the central bank's independence and maintain a cautious approach to monetary easing.
- On Thursday, the ECB left its Rate on Deposit Facility on hold at 2% and stuck to its view that inflation will stabilize around the 2% level, despite the soft Consumer Price Index (CPI) figures seen recently in the Eurozone. ECB President Christine Lagarde reiterated that monetary policy is in a "good place" and downplayed the risks to inflation stemming from a strong Euro.
- In the US, employment data raised alarms, with weekly Initial Jobless Claims surging to 231K in the week ending January 31, from 209K the previous week, and job openings dropping to five-year lows at 6.542 million in December, from 6.928 million in November.
- The weak employment figures come after a downbeat ADP Employment report on Wednesday and have boosted market expectations of a Fed interest rate cut in the first half of the year. The odds for a March rate cut have increased to 22% from 9% earlier this week, and chances of an April cut have risen to 40% from 24% in previous days, according to the CME Group's Fedwatch tool
- Data from the Eurozone released on Friday revealed that German Industrial Production contracted 1.9% in December, well beyond market expectations of a 0.3% drop, while November's data was revised down to a 0.2% growth from the 0.8% increase previously estimated.
- In the US, the preliminary Michigan Consumer Sentiment Index is expected to have deteriorated to 55.0 in February from 56.4 in January.
Technical Analysis: EUR/USD maintains its bearish tone, with 1.1765 low at risk
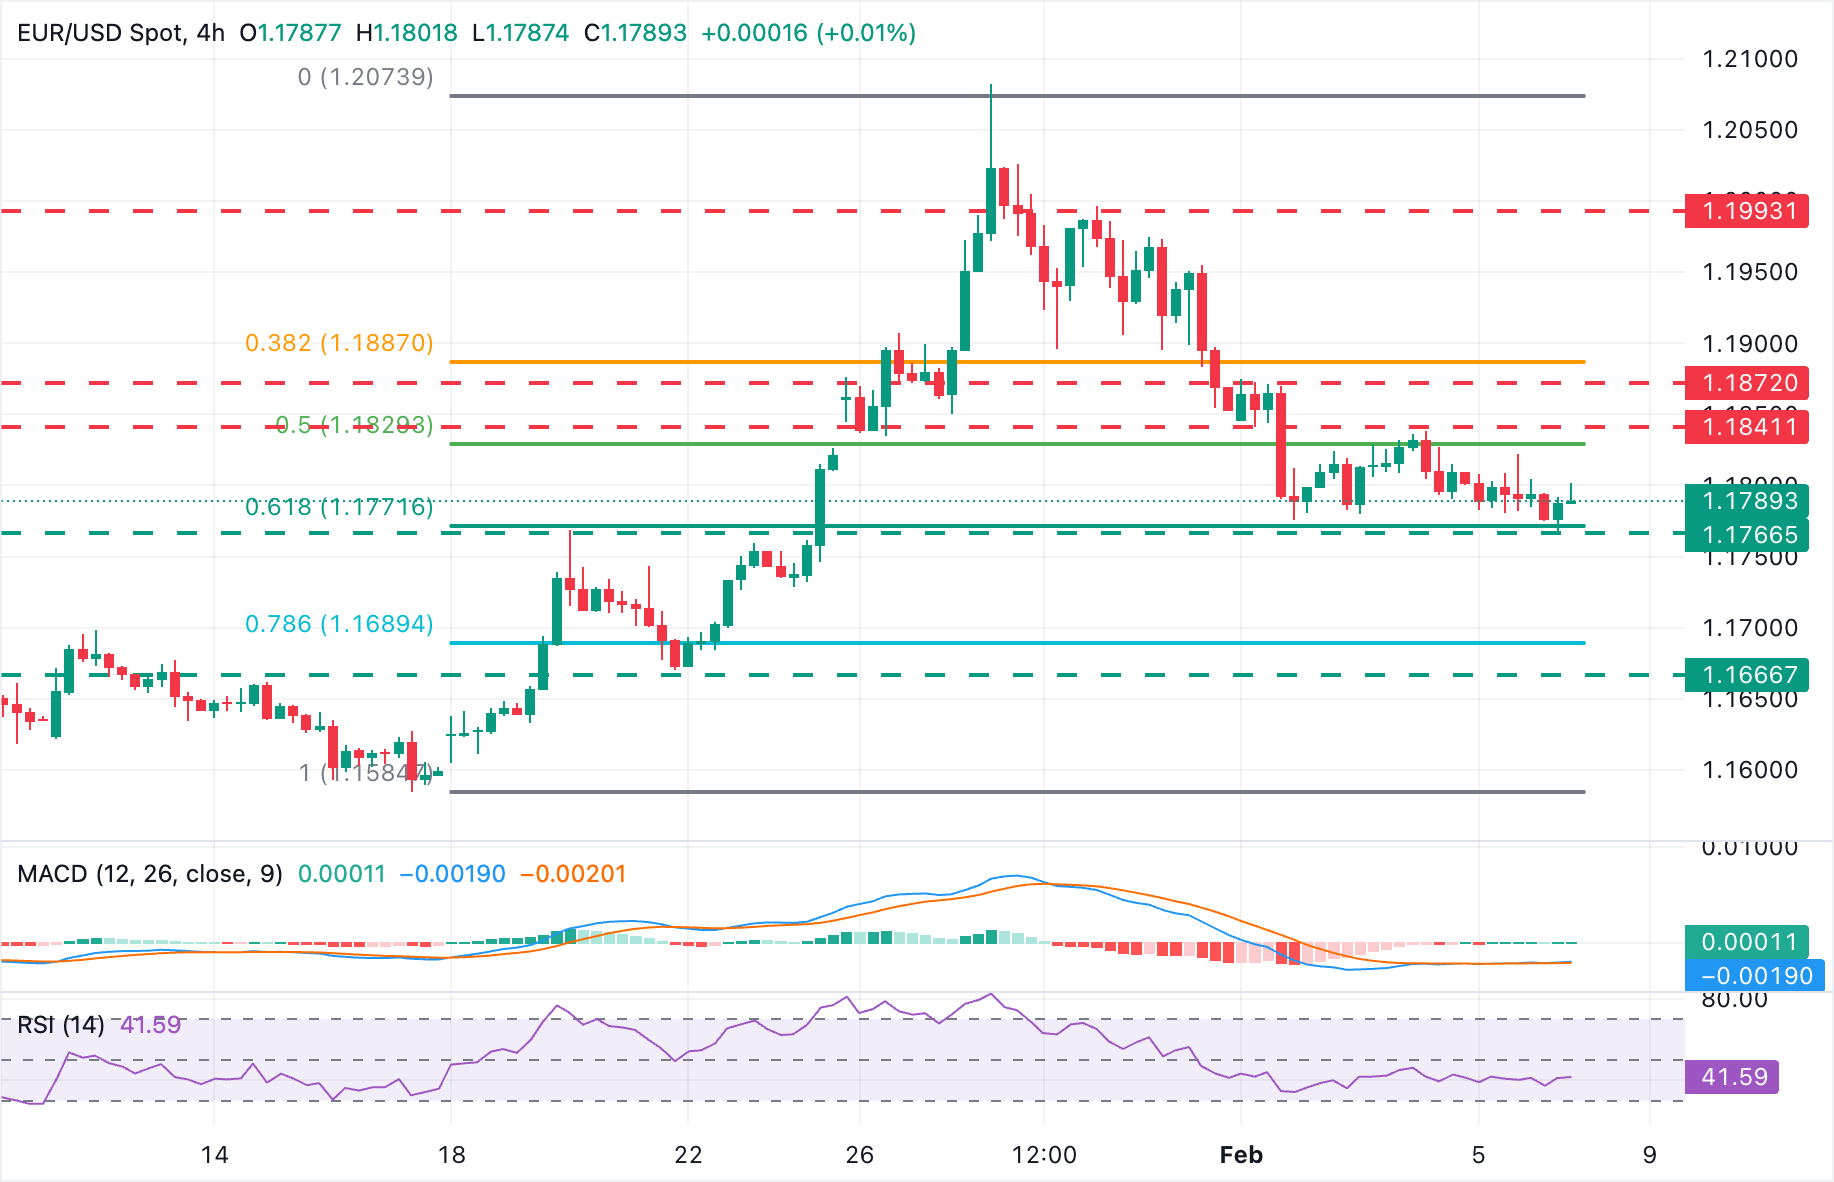
The EUR/USD is in a bearish correction, with technical indicators in the 4-hour chart showing a neutral-to-bearish trend. The Moving Average Convergence Divergence (MACD) line flattens near the Signal line, while the Relative Strength Index (RSI) remains steady below the 50 line, at levels consistent with a moderate bearish momentum.
The pair has found support in the area between the 61.8% Fibonacci retracement of the late January rally, at 1.1772, and the January 20 and 22 highs above 1.1765. Below these levels, the next target is the January 21 lownear 1.1670.
On the upside, the pair should break Wednesday's high, at 1.1838, and Monday's high, at 1.1874, to confirm a trend shift.
(The technical analysis of this story was written with the help of an AI tool.)
Economic Indicator
Industrial Production s.a. (MoM)
The Industrial Production released by the Statistisches Bundesamt Deutschland measures outputs of the German factories and mines. Changes in industrial production are widely followed as a major indicator of strength in the manufacturing sector. A high reading is seen as positive (or bullish) for the EUR, whereas a low reading is seen as negative (or bearish).
Read more.Last release: Fri Feb 06, 2026 07:00
Frequency: Monthly
Actual: -1.9%
Consensus: -0.3%
Previous: 0.8%
Source: Federal Statistics Office of Germany
Nothing in this material constitutes investment advice, personal recommendation, investment research, an offer, or a solicitation to buy or sell any financial instrument. The content has been prepared without consideration of your individual investment objectives, financial situation, or needs, and should not be treated as such.
Past performance is not a reliable indicator of future performance and/or results. Forward-looking scenarios or forecasts are not a guarantee of future performance. Actual results may differ materially from those anticipated.
Mitrade makes no representation or warranty as to the accuracy or completeness of the information provided and accepts no liability for any loss arising from reliance on such information.
Recommended Articles


