

Australian Dollar remains stronger near nine-day EMA barrier
- Australian Dollar remains firm after the release of mixed employment data on Thursday.
- Moving averages suggest that short-term bias is neutral.
- The RBA warned that rising financial risks and market disruptions could trigger a major downturn.
AUD/USD moves slightly upwards after registering losses in the previous session, trading around 0.7040 during the early European hours on Thursday. The Australian Dollar (AUD) stays firm against the US Dollar (USD) following the release of domestic employment data earlier in the day.
Data from the Australian Bureau of Statistics (ABS) showed the Unemployment Rate rose to 4.3% in February from 4.1% in January, exceeding expectations of 4.1%. Meanwhile, Employment Change increased by 48.9K, up from a revised 26.1K in January (previously 17.8K), well above the 20.3K forecast.
The Reserve Bank of Australia (RBA) cautioned that escalating tensions in the Middle East could deliver a shock to the global economy. The central bank warned that rising financial system risks and prolonged disruptions to oil and other markets could heighten the likelihood of a significant economic downturn.
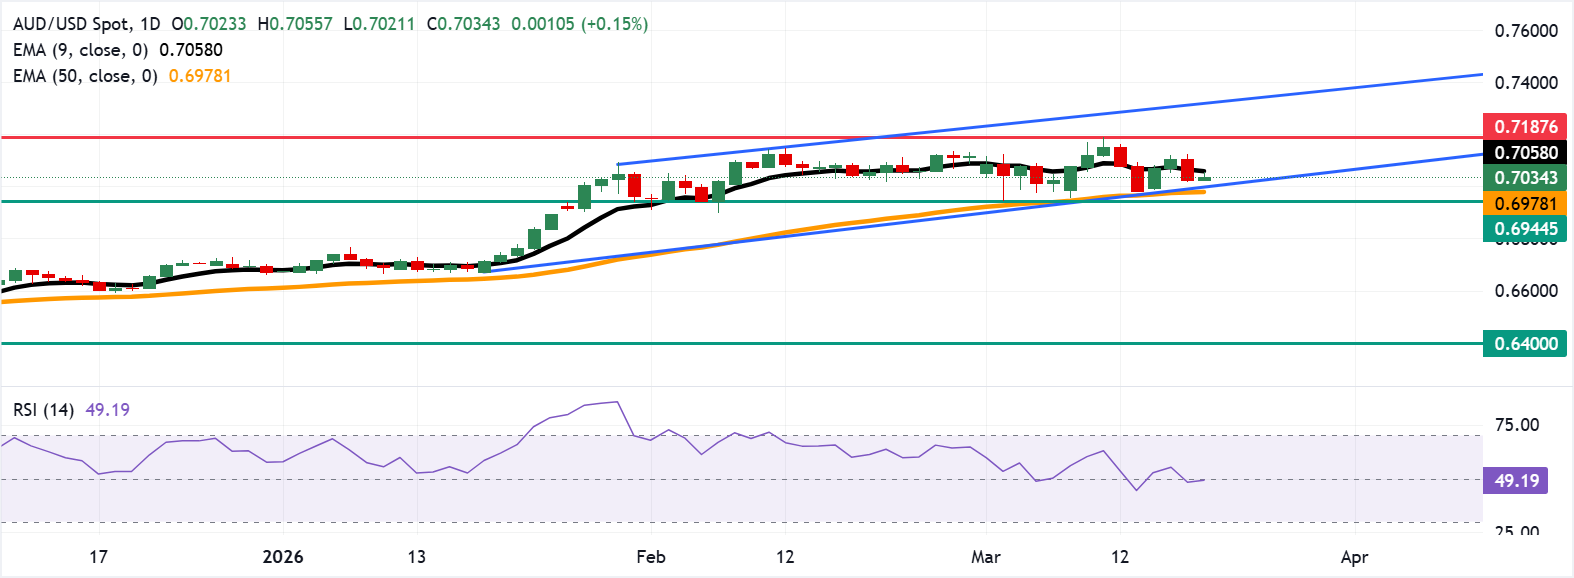
The technical analysis of the daily chart indicates that the pair is moving sideways within an ascending channel pattern suggests consolidation, with price likely to continue the uptrend unless a breakout or breakdown occurs.
The AUD/USD pair holds above the rising 50-day Exponential Moving Average (EMA) and below the nine-day average suggests the short-term consolidation within an overall uptrend, with the medium average acting as support and the nine-day average capping near-term upside.
The 14-day Relative Strength Index (RSI) sits just below 50 after retreating from overbought territory seen earlier in the month, indicating fading upside momentum but not an outright loss of bullish structure.
The AUD/USD pair could find the immediate resistance at the nine-day EMA of 0.7058, followed by the 0.7187, the highest since June 2022. On the downside, the immediate support lies at the lower boundary of the ascending channel around 0.7000, followed by the 50-day EMA of 0.6980.
(The technical analysis of this story was written with the help of an AI tool.)
Pound Sterling Price Today
The table below shows the percentage change of British Pound (GBP) against listed major currencies today. British Pound was the strongest against the US Dollar.
| USD | EUR | GBP | JPY | CAD | AUD | NZD | CHF | |
|---|---|---|---|---|---|---|---|---|
| USD | -0.16% | -0.07% | -0.26% | -0.05% | -0.23% | -0.34% | -0.21% | |
| EUR | 0.16% | 0.08% | -0.09% | 0.10% | -0.07% | -0.19% | -0.05% | |
| GBP | 0.07% | -0.08% | -0.19% | 0.03% | -0.15% | -0.27% | -0.14% | |
| JPY | 0.26% | 0.09% | 0.19% | 0.21% | 0.02% | -0.12% | 0.06% | |
| CAD | 0.05% | -0.10% | -0.03% | -0.21% | -0.17% | -0.31% | -0.17% | |
| AUD | 0.23% | 0.07% | 0.15% | -0.02% | 0.17% | -0.13% | 0.00% | |
| NZD | 0.34% | 0.19% | 0.27% | 0.12% | 0.31% | 0.13% | 0.13% | |
| CHF | 0.21% | 0.05% | 0.14% | -0.06% | 0.17% | -0.01% | -0.13% |
The heat map shows percentage changes of major currencies against each other. The base currency is picked from the left column, while the quote currency is picked from the top row. For example, if you pick the British Pound from the left column and move along the horizontal line to the US Dollar, the percentage change displayed in the box will represent GBP (base)/USD (quote).
Nothing in this material constitutes investment advice, personal recommendation, investment research, an offer, or a solicitation to buy or sell any financial instrument. The content has been prepared without consideration of your individual investment objectives, financial situation, or needs, and should not be treated as such.
Past performance is not a reliable indicator of future performance and/or results. Forward-looking scenarios or forecasts are not a guarantee of future performance. Actual results may differ materially from those anticipated.
Mitrade makes no representation or warranty as to the accuracy or completeness of the information provided and accepts no liability for any loss arising from reliance on such information.
Recommended Articles


