

GBP/USD price Forecast: Rally halts near 61.8% Fibo retracement at 1.3600
- GBP/USD falls to near 1.3545 as the US Dollar recovers despite market sentiment remaining risk-on.
- There has been no announcement of the second round of US-Iran talks.
- UK monthly GDP grew strongly by 0.5% in February.
The GBP/USD pair trades 0.1% lower to near 1.3545 during the European trading session on Thursday, struggling to extend the rally above the 1.3600 hurdle. The Cable faces slight selling pressure as the US Dollar (USD) turns positive after recovering early losses, despite market sentiment remaining risk-on.
At press time, S&P 500 futures trade 0.2% higher around 7,070, reflecting an upbeat market mood. The US Dollar Index (DXY), which tracks the Greenback’s value against six major currencies, trades 0.15% higher to near 98.20.
Market sentiment remains favorable for riskier assets amid firm hopes that the United States (US) and Iran would announce a permanent ceasefire soon. However, there is no announcement of a date for another round of talks between the two nations.
Pakistan’s foreign ministry stated earlier in the day on Thursday that dates for another round of talks between the United States (US) and Iran regarding the permanent ceasefire have not been finalized yet.
On the domestic front, the United Kingdom (UK) monthly Gross Domestic Product (GDP) data for February has come in stronger than projected. The Office for National Statistics (ONS) has reported that the economy expanded at a 0.5% pace, while it was expected to remain steady at 0.1%.
GBP/USD technical analysis
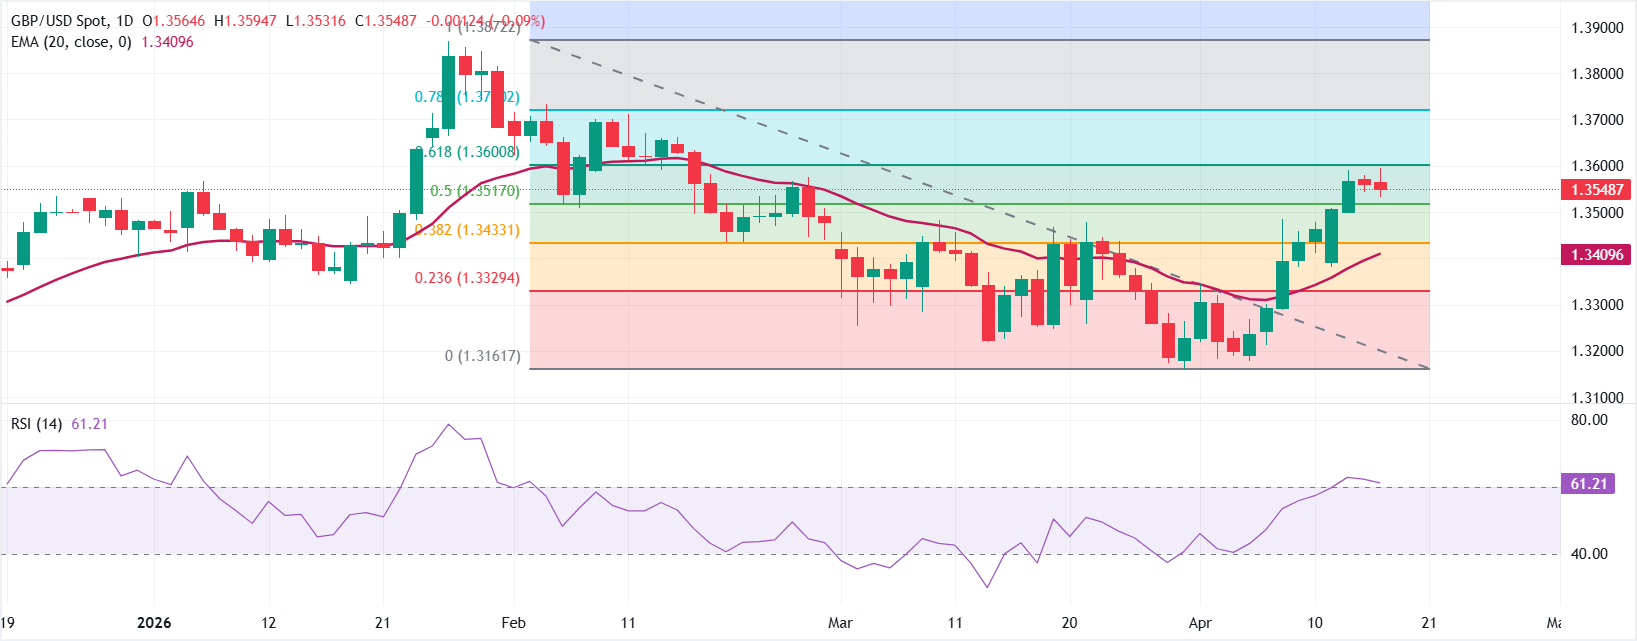
GBP/USD trades lower at around 1.3545 as of writing. The pair holds above the 20-day exponential moving average (EMA) at 1.3410 and has reclaimed the 50.0% Fibonacci retracement of the 1.3162–1.3872 swing at 1.3517, which together suggest a constructive near-term bias.
The Relative Strength Index (14) at 61.4 leans bullish without yet flagging overbought conditions, hinting that upside momentum is still in play while the price action consolidates after the recent advance.
On the topside, immediate resistance is seen at the 61.8% Fibonacci retracement at 1.3601, ahead of the 78.6% level at 1.3720 and the cycle high near the 100.0% retracement at 1.3872. Looking down, initial support is provided by the 50.0% retracement at 1.3517, followed by the 38.2% level at 1.3433 and the 20-day EMA at 1.3410; a deeper pullback could expose the 23.6% retracement at 1.3329 before the structural floor around 1.3162.
(The technical analysis of this story was written with the help of an AI tool.)
Economic Indicator
Gross Domestic Product (MoM)
The Gross Domestic Product (GDP), released by the Office for National Statistics on a monthly and quarterly basis, is a measure of the total value of all goods and services produced in the UK during a given period. The GDP is considered as the main measure of UK economic activity. The MoM reading compares economic activity in the reference month to the previous month. Generally, a rise in this indicator is bullish for the Pound Sterling (GBP), while a low reading is seen as bearish.
Read more.Last release: Thu Apr 16, 2026 06:00
Frequency: Monthly
Actual: 0.5%
Consensus: 0.1%
Previous: 0%
Source: Office for National Statistics
Nothing in this material constitutes investment advice, personal recommendation, investment research, an offer, or a solicitation to buy or sell any financial instrument. The content has been prepared without consideration of your individual investment objectives, financial situation, or needs, and should not be treated as such.
Past performance is not a reliable indicator of future performance and/or results. Forward-looking scenarios or forecasts are not a guarantee of future performance. Actual results may differ materially from those anticipated.
Mitrade makes no representation or warranty as to the accuracy or completeness of the information provided and accepts no liability for any loss arising from reliance on such information.
Recommended Articles


