

EUR/GBP weakens as UK CPI lifts GBP; technicals signal downside below 200-day SMA
- EUR/GBP falls to multi-week lows as the British Pound gains on firm UK inflation.
- UK CPI accelerates to 3.3% YoY and monthly inflation jumps to 0.7%.
- Technically, EUR/GBP trades with a bearish bias below 100- and 200-day SMAs.
EUR/GBP trades on the back foot on Wednesday as UK inflation data lifts the British Pound (GBP), pressuring the Euro (EUR), with the cross extending losses for the second consecutive day. At the time of writing, EUR/GBP is trading around 0.8680, its lowest level since March 31.
Data released by the UK’s Office for National Statistics showed that the headline Consumer Price Index (CPI) rose to around 3.3% YoY in March from 3.0% previously, while monthly inflation increased to 0.7% from 0.4%. The rise was mainly driven by higher energy and fuel costs amid ongoing Middle East tensions. However, core CPI eased slightly to 3.1% from 3.2%, suggesting underlying price pressures are not broad-based for now.
As inflation continues to trend above the Bank of England’s 2% target, policymakers may adopt a wait-and-see approach before considering any rate cuts, and could even raise rates if the energy shock leads to second-round inflation effects.
Meanwhile, Eurozone data added to downside pressure on the Euro, with preliminary Consumer Confidence for April falling to -20.6 from -16.3 previously, pointing to weakening household sentiment across the bloc amid ongoing geopolitical tensions and higher energy prices.
Technical Analysis:
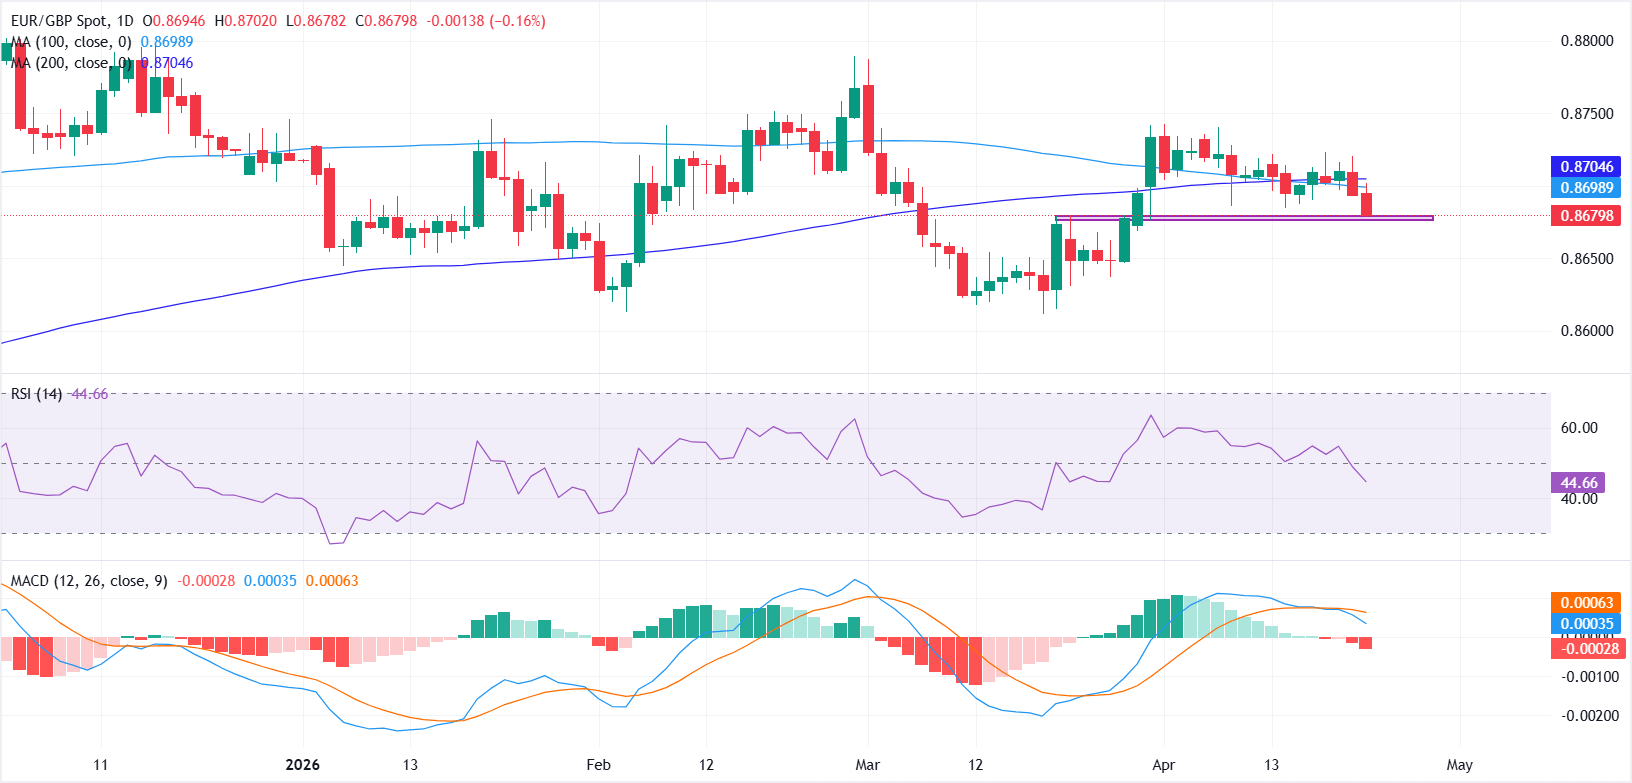
In the daily chart, EUR/GBP trades with a bearish near-term bias as spot holds beneath both the 100-day Simple Moving Average (SMA) at 0.8699 and the 200-day SMA at 0.8705.
The pair’s slide below these medium- and long-term averages suggests rallies are likely to be capped while momentum indicators lean soft, with the Relative Strength Index (RSI) hovering below the 50 line and the Moving Average Convergence Divergence (MACD) slipping marginally into negative territory, hinting at waning upside pressure.
On the upside, EUR/GBP faces initial resistance at the overhead SMAs around the 0.8690-0.8705 region, with a break above opening the door toward the April high near 0.8742. On the downside, immediate support is seen around the 0.8680 level, with a break below exposing the 0.8650 region.
Pound Sterling Price Today
The table below shows the percentage change of British Pound (GBP) against listed major currencies today. British Pound was the strongest against the Swiss Franc.
| USD | EUR | GBP | JPY | CAD | AUD | NZD | CHF | |
|---|---|---|---|---|---|---|---|---|
| USD | 0.12% | -0.03% | -0.06% | -0.05% | -0.12% | -0.32% | 0.24% | |
| EUR | -0.12% | -0.14% | -0.19% | -0.16% | -0.24% | -0.44% | 0.11% | |
| GBP | 0.03% | 0.14% | -0.04% | -0.01% | -0.08% | -0.28% | 0.26% | |
| JPY | 0.06% | 0.19% | 0.04% | 0.02% | -0.04% | -0.25% | 0.28% | |
| CAD | 0.05% | 0.16% | 0.00% | -0.02% | -0.06% | -0.25% | 0.28% | |
| AUD | 0.12% | 0.24% | 0.08% | 0.04% | 0.06% | -0.21% | 0.33% | |
| NZD | 0.32% | 0.44% | 0.28% | 0.25% | 0.25% | 0.21% | 0.54% | |
| CHF | -0.24% | -0.11% | -0.26% | -0.28% | -0.28% | -0.33% | -0.54% |
The heat map shows percentage changes of major currencies against each other. The base currency is picked from the left column, while the quote currency is picked from the top row. For example, if you pick the British Pound from the left column and move along the horizontal line to the US Dollar, the percentage change displayed in the box will represent GBP (base)/USD (quote).
Nothing in this material constitutes investment advice, personal recommendation, investment research, an offer, or a solicitation to buy or sell any financial instrument. The content has been prepared without consideration of your individual investment objectives, financial situation, or needs, and should not be treated as such.
Past performance is not a reliable indicator of future performance and/or results. Forward-looking scenarios or forecasts are not a guarantee of future performance. Actual results may differ materially from those anticipated.
Mitrade makes no representation or warranty as to the accuracy or completeness of the information provided and accepts no liability for any loss arising from reliance on such information.
Recommended Articles


