

WTI Price Forecast: Short-term momentum improves above 21-day SMA
- WTI eases after rallying nearly 4% the previous day as markets reassess US oversight of Venezuelan Oil.
- US President Donald Trump signals potential $100 billion investment in Venezuela’s Oil sector, reviving oversupply concerns.
- Technically, near-term momentum improves, but the longer-term trend remains fragile.
West Texas Intermediate (WTI) trades with a negative bias on Friday after posting solid gains the previous day, as traders continue to assess the implications of increased US oversight of Venezuelan Oil following recent military action in Caracas. At the time of writing, WTI trades around $58.00, easing after climbing nearly 4% on Thursday.
US involvement could eventually unlock Venezuela’s vast Oil reserves and add to an already oversupplied market. US President Donald Trump is set to meet with Oil executives at the White House later on Friday. Trump wrote on Truth Social that “at least $100 billion” could be invested by major US Oil firms in rebuilding Venezuelan Oil infrastructure.
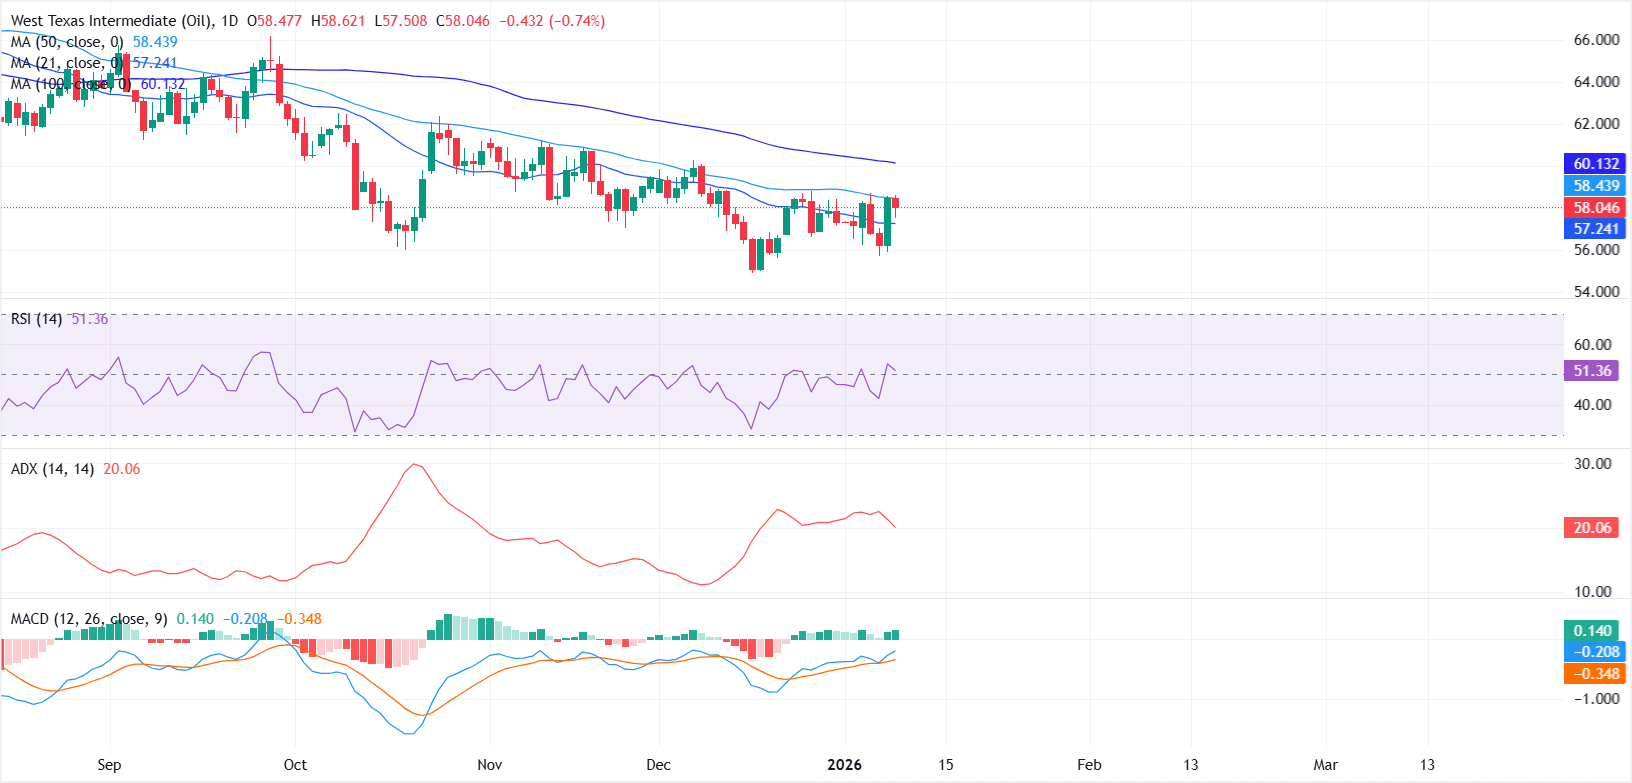
From a technical perspective, WTI’s near-term outlook steadies as the daily chart shows price reclaiming the 21-day Simple Moving Average (SMA), while the Relative Strength Index (RSI) has climbed back above the 50 threshold, signalling improving short-term momentum. However, the broader structure remains bearish, with longer-term moving averages still capping upside attempts.
The 50-day SMA near $58.34 is acting as immediate resistance. A decisive daily close above this area could open the door toward the 100-day SMA near $60.13, although sellers are likely to re-emerge given repeated rejections from the $60.00 psychological level.
On the downside, the rising 21-day SMA around $57.24 provides initial support, followed by the $56.00 zone, where buying interest has emerged.
The Moving Average Convergence Divergence (MACD) line holds above the signal line near the zero mark, with the histogram widening in positive territory, pointing to strengthening bullish momentum. Meanwhile, the Average Directional Index (ADX) hovering near 20 suggests the broader trend remains weak, highlighting the risk of continued choppy price action.
WTI Oil FAQs
WTI Oil is a type of Crude Oil sold on international markets. The WTI stands for West Texas Intermediate, one of three major types including Brent and Dubai Crude. WTI is also referred to as “light” and “sweet” because of its relatively low gravity and sulfur content respectively. It is considered a high quality Oil that is easily refined. It is sourced in the United States and distributed via the Cushing hub, which is considered “The Pipeline Crossroads of the World”. It is a benchmark for the Oil market and WTI price is frequently quoted in the media.
Like all assets, supply and demand are the key drivers of WTI Oil price. As such, global growth can be a driver of increased demand and vice versa for weak global growth. Political instability, wars, and sanctions can disrupt supply and impact prices. The decisions of OPEC, a group of major Oil-producing countries, is another key driver of price. The value of the US Dollar influences the price of WTI Crude Oil, since Oil is predominantly traded in US Dollars, thus a weaker US Dollar can make Oil more affordable and vice versa.
The weekly Oil inventory reports published by the American Petroleum Institute (API) and the Energy Information Agency (EIA) impact the price of WTI Oil. Changes in inventories reflect fluctuating supply and demand. If the data shows a drop in inventories it can indicate increased demand, pushing up Oil price. Higher inventories can reflect increased supply, pushing down prices. API’s report is published every Tuesday and EIA’s the day after. Their results are usually similar, falling within 1% of each other 75% of the time. The EIA data is considered more reliable, since it is a government agency.
OPEC (Organization of the Petroleum Exporting Countries) is a group of 12 Oil-producing nations who collectively decide production quotas for member countries at twice-yearly meetings. Their decisions often impact WTI Oil prices. When OPEC decides to lower quotas, it can tighten supply, pushing up Oil prices. When OPEC increases production, it has the opposite effect. OPEC+ refers to an expanded group that includes ten extra non-OPEC members, the most notable of which is Russia.
Nothing in this material constitutes investment advice, personal recommendation, investment research, an offer, or a solicitation to buy or sell any financial instrument. The content has been prepared without consideration of your individual investment objectives, financial situation, or needs, and should not be treated as such.
Past performance is not a reliable indicator of future performance and/or results. Forward-looking scenarios or forecasts are not a guarantee of future performance. Actual results may differ materially from those anticipated.
Mitrade makes no representation or warranty as to the accuracy or completeness of the information provided and accepts no liability for any loss arising from reliance on such information.
Recommended Articles


