

Dogecoin Price Forecast: DOGE remains range-bound amid major ETF inflows, low retail demand
- Dogecoin extends its pullback on Friday after losing support at the 50-day EMA, while remaining confined to a broader range.
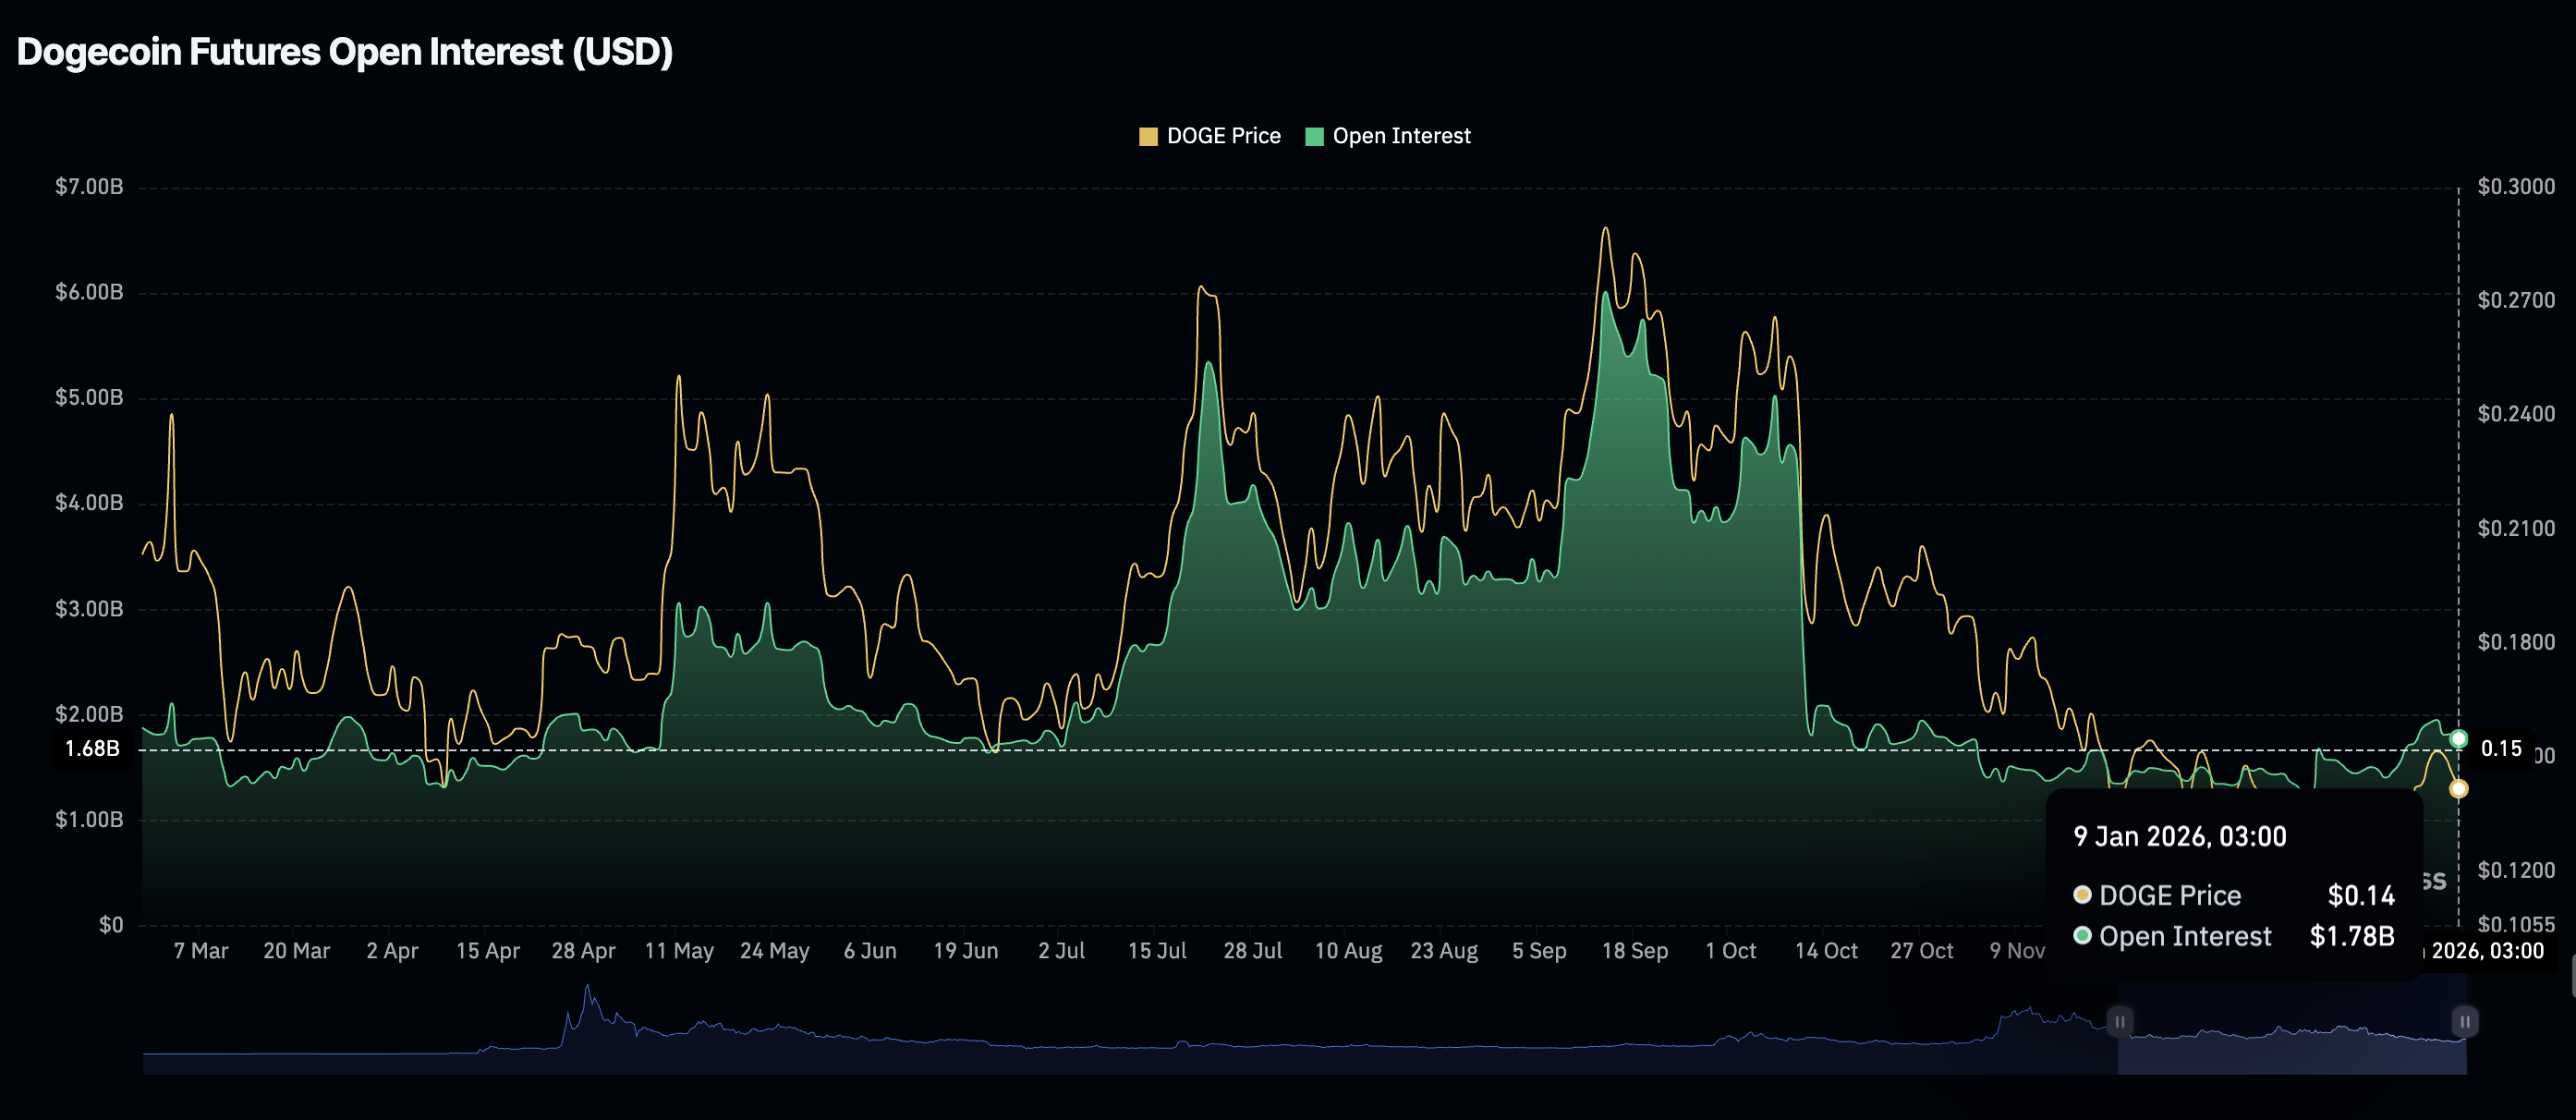
- The derivatives market claws back gains as futures Open Interest drops to $1.82 billion.
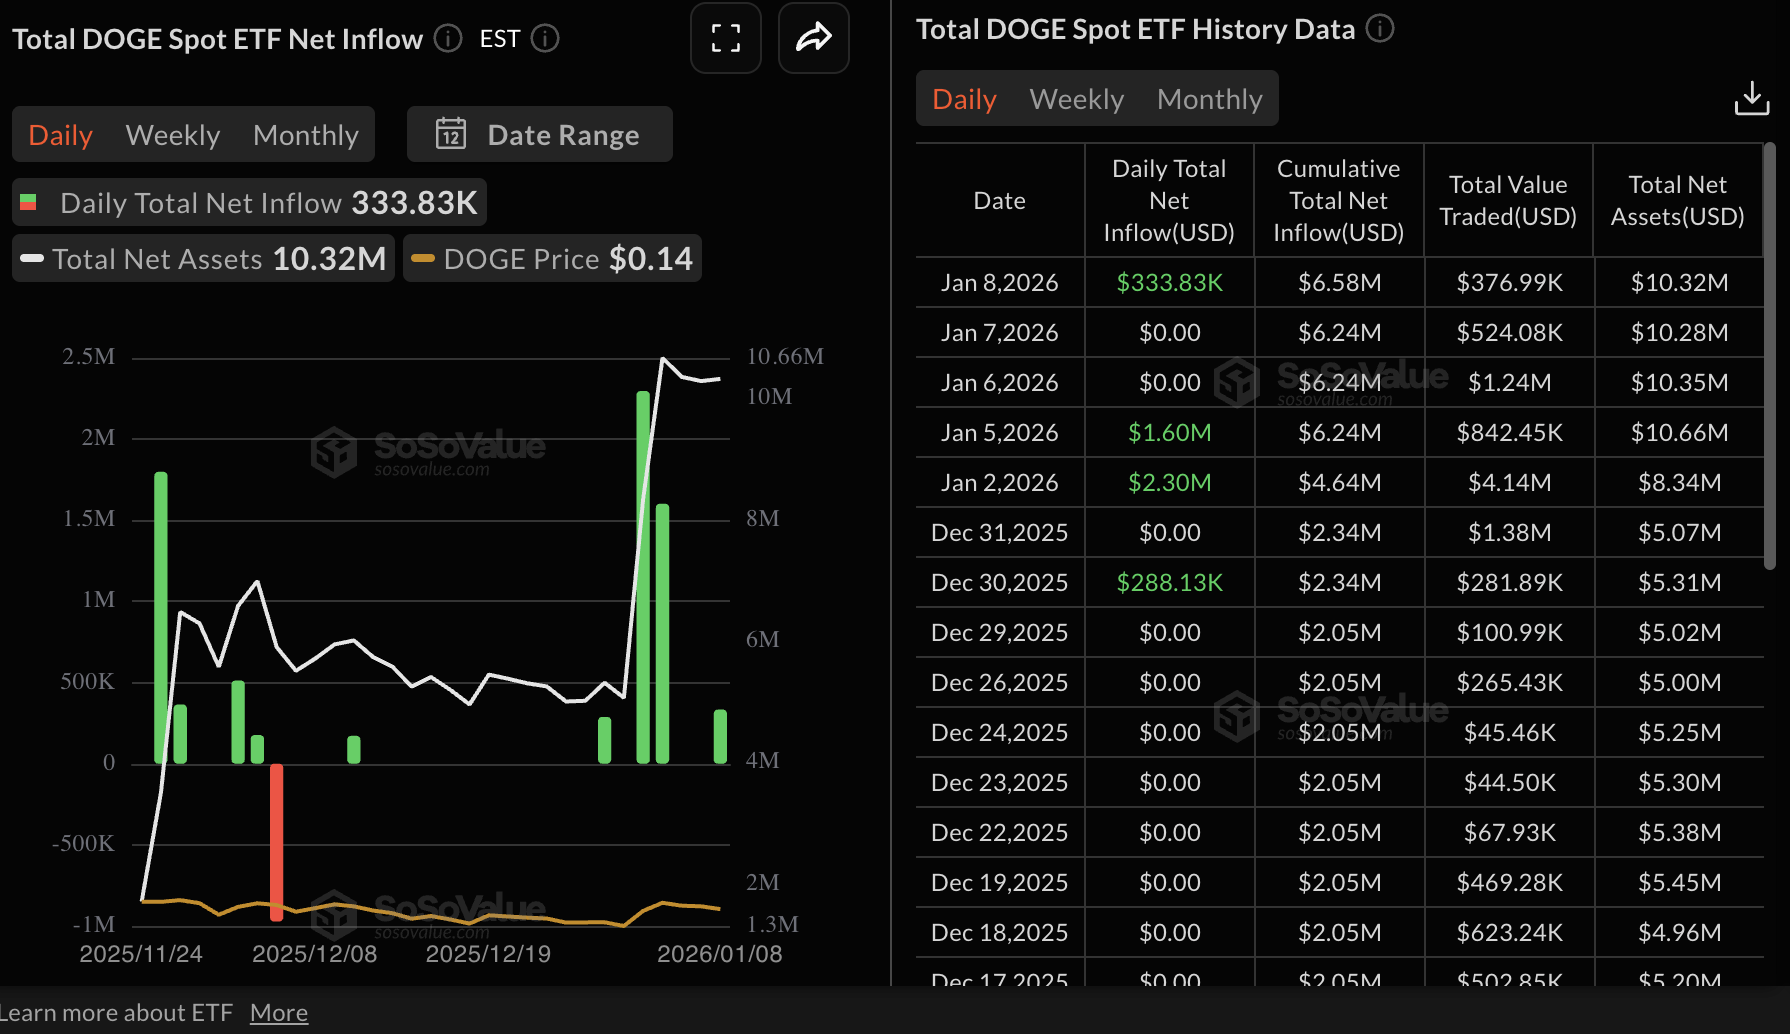
- DOGE ETFs post modest inflows despite rising volatility across the broader crypto market.
Dogecoin (DOGE) is trading down at the time of writing on Friday, reflecting a sudden spike in volatility following the release of the United States (US) Nonfarm Payrolls (NFP) report.
The Bureau of Labor Statistics (BLS) reported that the US NFP rose by 50,000 in December, below market expectations of 60,000.
The Unemployment Rate declined to 4.4%, below the 4.5% forecast. This reading followed November’s 56,000 (revised from 64,000). The BLS stated in its press release that “with these revisions, employment in October and November combined is 76,000 lower than previously reported."
The crypto market reacted with increased volatility, with Dogecoin posting a 2% intraday loss to trade at $1.1430 on Friday. Bitcoin (BTC) is testing the critical $90,000 level, while Ethereum declined slightly but remained above $3,000.
Dogecoin slides amid falling retail demand and minor ETF inflows
Dogecoin’s derivatives market is softening after a brief rise to $1.96 billion on Tuesday in futures Open Interest (OI). This surge from $1.55 billion on January 1 occurred amid an overall increase in risk appetite for crypto assets, including meme coins.
However, macroeconomic uncertainty weighed on markets, triggering a widespread sell-off, as OI narrowed to $1.82 billion on Friday. If the downward trend persists, signaling low retail demand, price recovery could be a pipe dream. The chances of the downtrend extending to test the December low of $0.1161 would increase significantly.
Meanwhile, Dogecoin spot ETFs recorded a minor inflow of nearly $334,000 on Thursday, despite heightened volatility in the crypto market this week.
SoSoValue data shows the ETF products listed in the US posted the largest inflow since launch, $2.3 million on January 2, followed by the second-largest, $1.6 million on Monday. A steady increase in ETF inflows could boost risk appetite and increase the odds of Dogecoin’s recovery.
Technical outlook: Dogecoin faces ongoing downside pressure
Dogecoin is trading at $1.1430 at the time of writing on Friday, with the 50-day Exponential Moving Average (EMA) capping immediate recovery attempts at $0.1436. The 100-day EMA trends lower at $0.1608, maintaining a broader bearish tone alongside a declining 200-day EMA at $0.1791.
The Moving Average Convergence Divergence (MACD) indicator on the daily chart holds in positive territory with the blue line above the red signal line, which suggests that bulls have a slight edge over bears. However, the positive histogram in green above the mean line has begun to contract, indicating that momentum is cooling.
The Relative Strength Index stands at 55 (neutral-to-bullish) on the same chart. A decisive push higher would strengthen Dogecoin's recovery case.
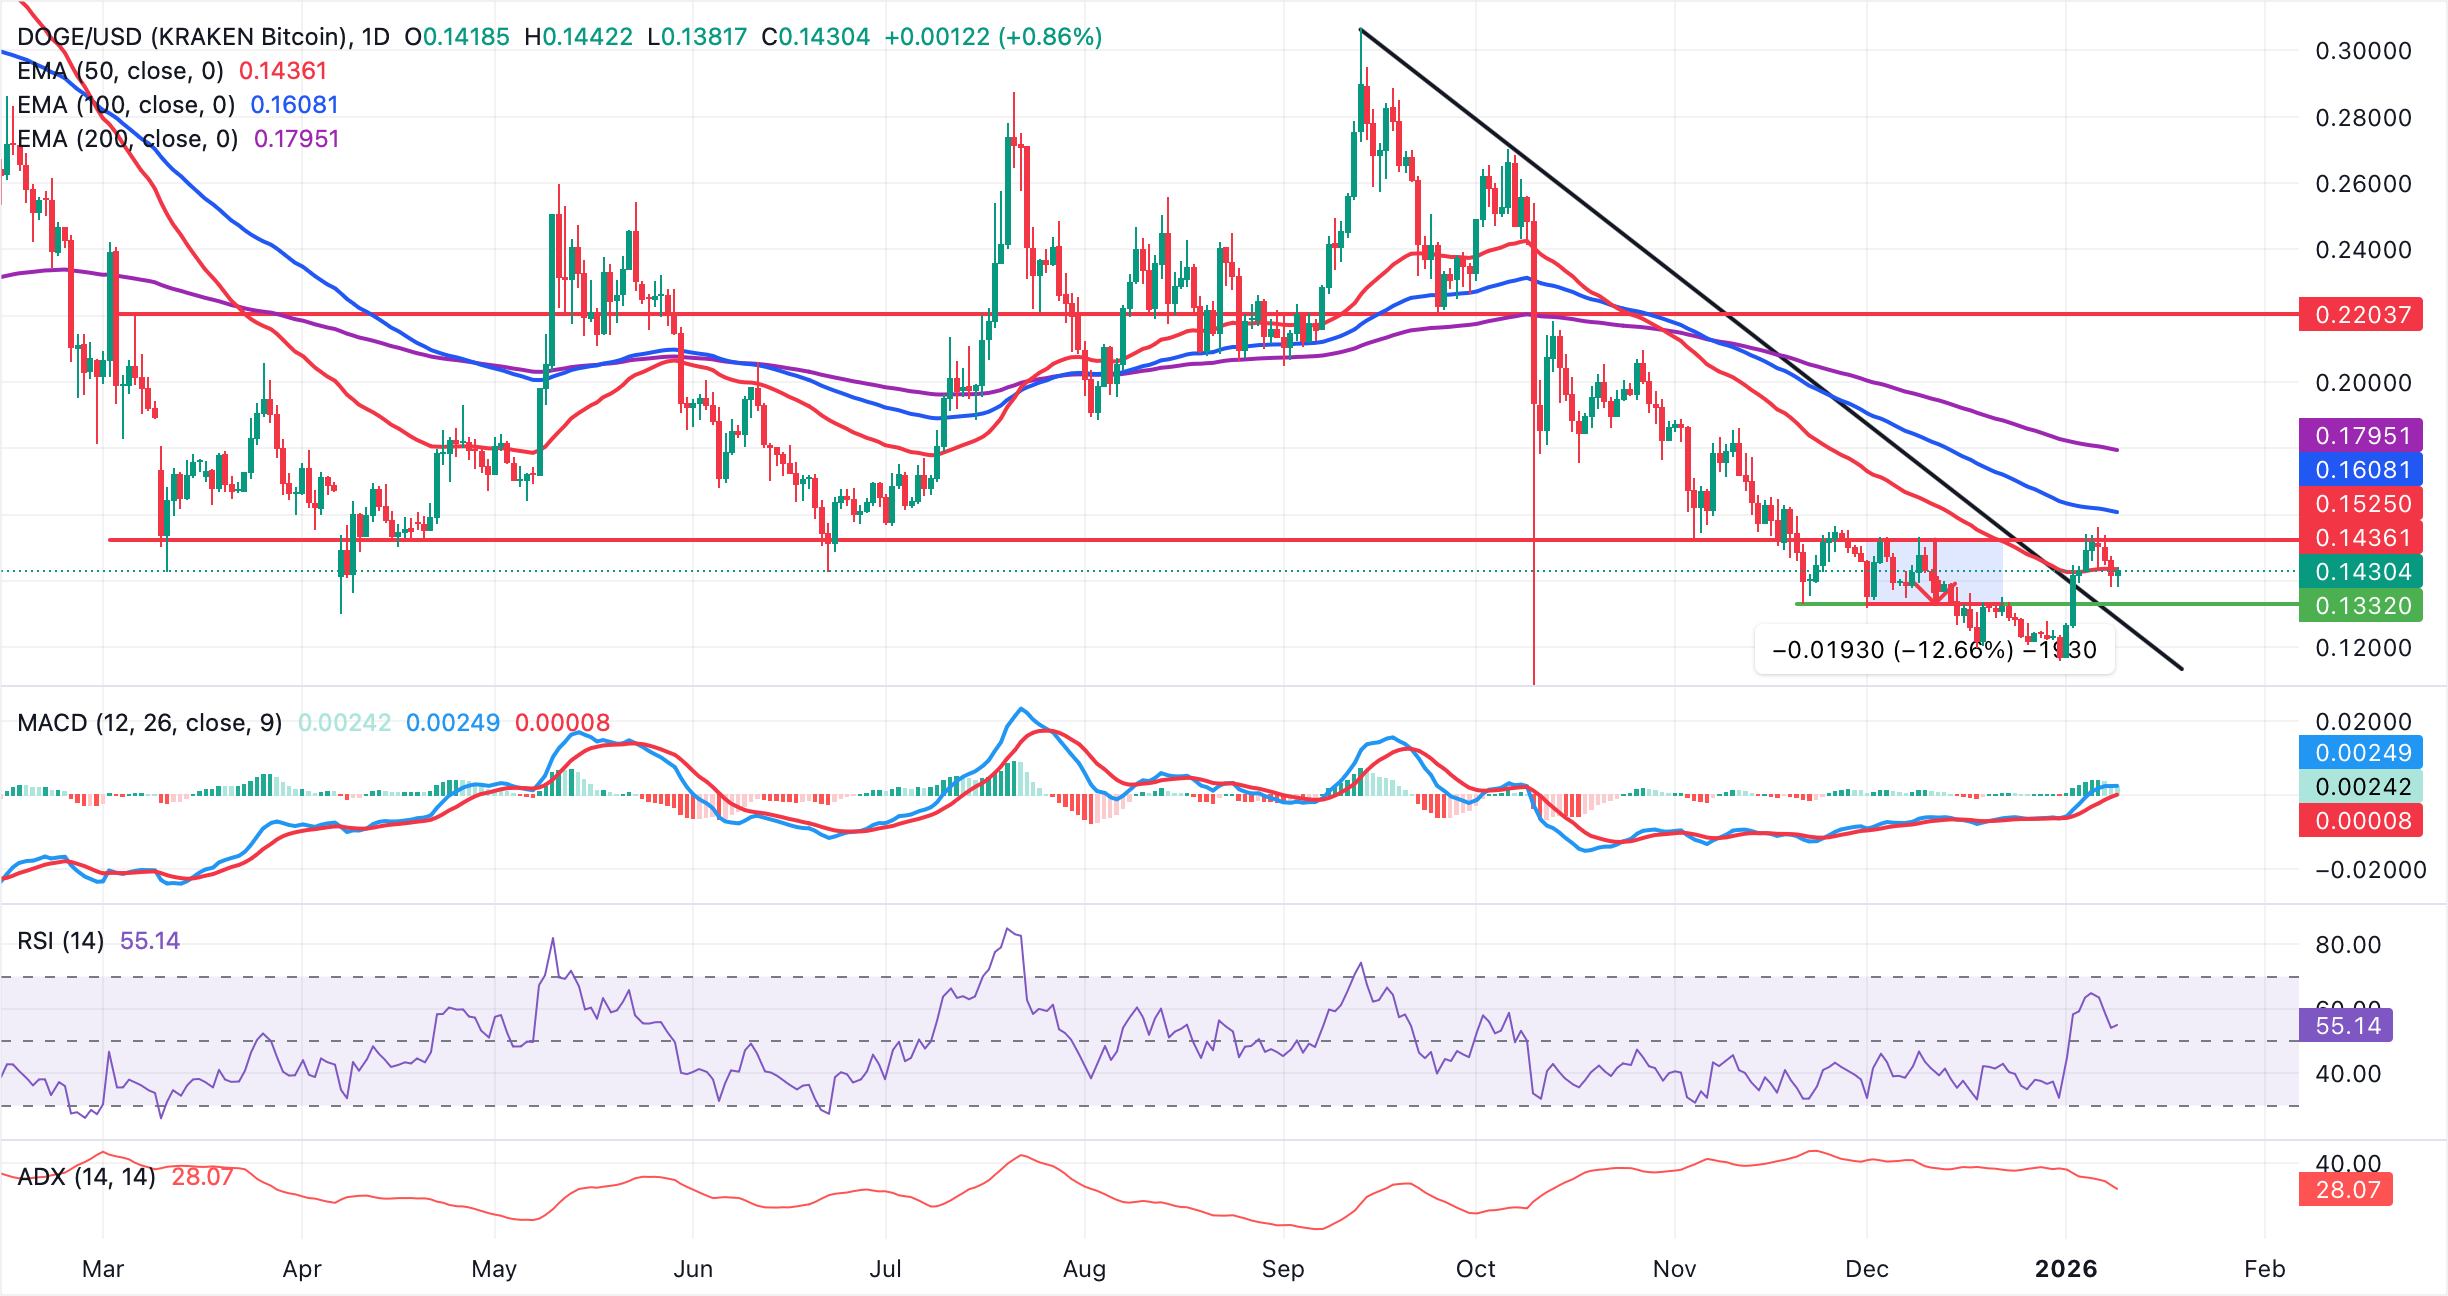
The descending trend line from $0.3063 was broken near $0.1276, turning the same area into initial support. If buyers defend this price level, focus would shift to resistance at the 200-day EMA near $0.1795, whereas a failure to hold would risk fading back toward the breakout zone.
Crypto ETF FAQs
An Exchange-Traded Fund (ETF) is an investment vehicle or an index that tracks the price of an underlying asset. ETFs can not only track a single asset, but a group of assets and sectors. For example, a Bitcoin ETF tracks Bitcoin’s price. ETF is a tool used by investors to gain exposure to a certain asset.
Yes. The first Bitcoin futures ETF in the US was approved by the US Securities & Exchange Commission in October 2021. A total of seven Bitcoin futures ETFs have been approved, with more than 20 still waiting for the regulator’s permission. The SEC says that the cryptocurrency industry is new and subject to manipulation, which is why it has been delaying crypto-related futures ETFs for the last few years.
Yes. The SEC approved in January 2024 the listing and trading of several Bitcoin spot Exchange-Traded Funds, opening the door to institutional capital and mainstream investors to trade the main crypto currency. The decision was hailed by the industry as a game changer.
The main advantage of crypto ETFs is the possibility of gaining exposure to a cryptocurrency without ownership, reducing the risk and cost of holding the asset. Other pros are a lower learning curve and higher security for investors since ETFs take charge of securing the underlying asset holdings. As for the main drawbacks, the main one is that as an investor you can’t have direct ownership of the asset, or, as they say in crypto, “not your keys, not your coins.” Other disadvantages are higher costs associated with holding crypto since ETFs charge fees for active management. Finally, even though investing in ETFs reduces the risk of holding an asset, price swings in the underlying cryptocurrency are likely to be reflected in the investment vehicle too.
(The technical analysis of this story was written with the help of an AI tool)
Nothing in this material constitutes investment advice, personal recommendation, investment research, an offer, or a solicitation to buy or sell any financial instrument. The content has been prepared without consideration of your individual investment objectives, financial situation, or needs, and should not be treated as such.
Past performance is not a reliable indicator of future performance and/or results. Forward-looking scenarios or forecasts are not a guarantee of future performance. Actual results may differ materially from those anticipated.
Mitrade makes no representation or warranty as to the accuracy or completeness of the information provided and accepts no liability for any loss arising from reliance on such information.
Recommended Articles


