


Crypto Today: Bitcoin, Ethereum, XRP extend correction amid mixed ETF flows, dwindling retail interest
- Bitcoin consolidates above $77,000 after plummeting and testing April’s tariff-triggered lows, as investors remain cautious.
- Ethereum extends losses toward the psychological $2,000 support amid ETF outflows.
- XRP holds below its April low at $1.61 as futures Open Interest drops to $2.81 billion.
Bitcoin (BTC) is trading under pressure at the time of writing on Monday, as digital assets across the board extend their correction following a turbulent week. The King of Crypto holds above $77,000 after a sharp decline that briefly tested lows last seen during April’s tariff-driven selloff at $74,476.
Altcoins, including Ethereum (ETH) and Ripple (XRP), are following in BTC’s footsteps, grinding lower amid declining speculative appetite. Traders remain cautious, monitoring key technical levels to gauge whether the current consolidation represents a temporary pause or signals deeper downside risk ahead.
Low institutional and retail interest weighs on BTC, ETH and XRP
Bitcoin continued through last week, exacerbated by a risk-off sentiment spreading across global markets after United States (US) President Donald Trump’s nomination of Kevin Warsh as the next Federal Reserve (Fed) Chair – Warsh served as Fed governor and as an economic adviser to the president.
The Fed paused its monetary policy easing cycle on Wednesday, leaving interest rates unchanged at the 3.50%-3.75% range. Fed Chair Jerome Powell took a hawkish stance during the post-meeting press conference. Moreover, the lack of signals for future rate cuts has reduced risk appetite for high-risk assets such as Bitcoin and altcoins.
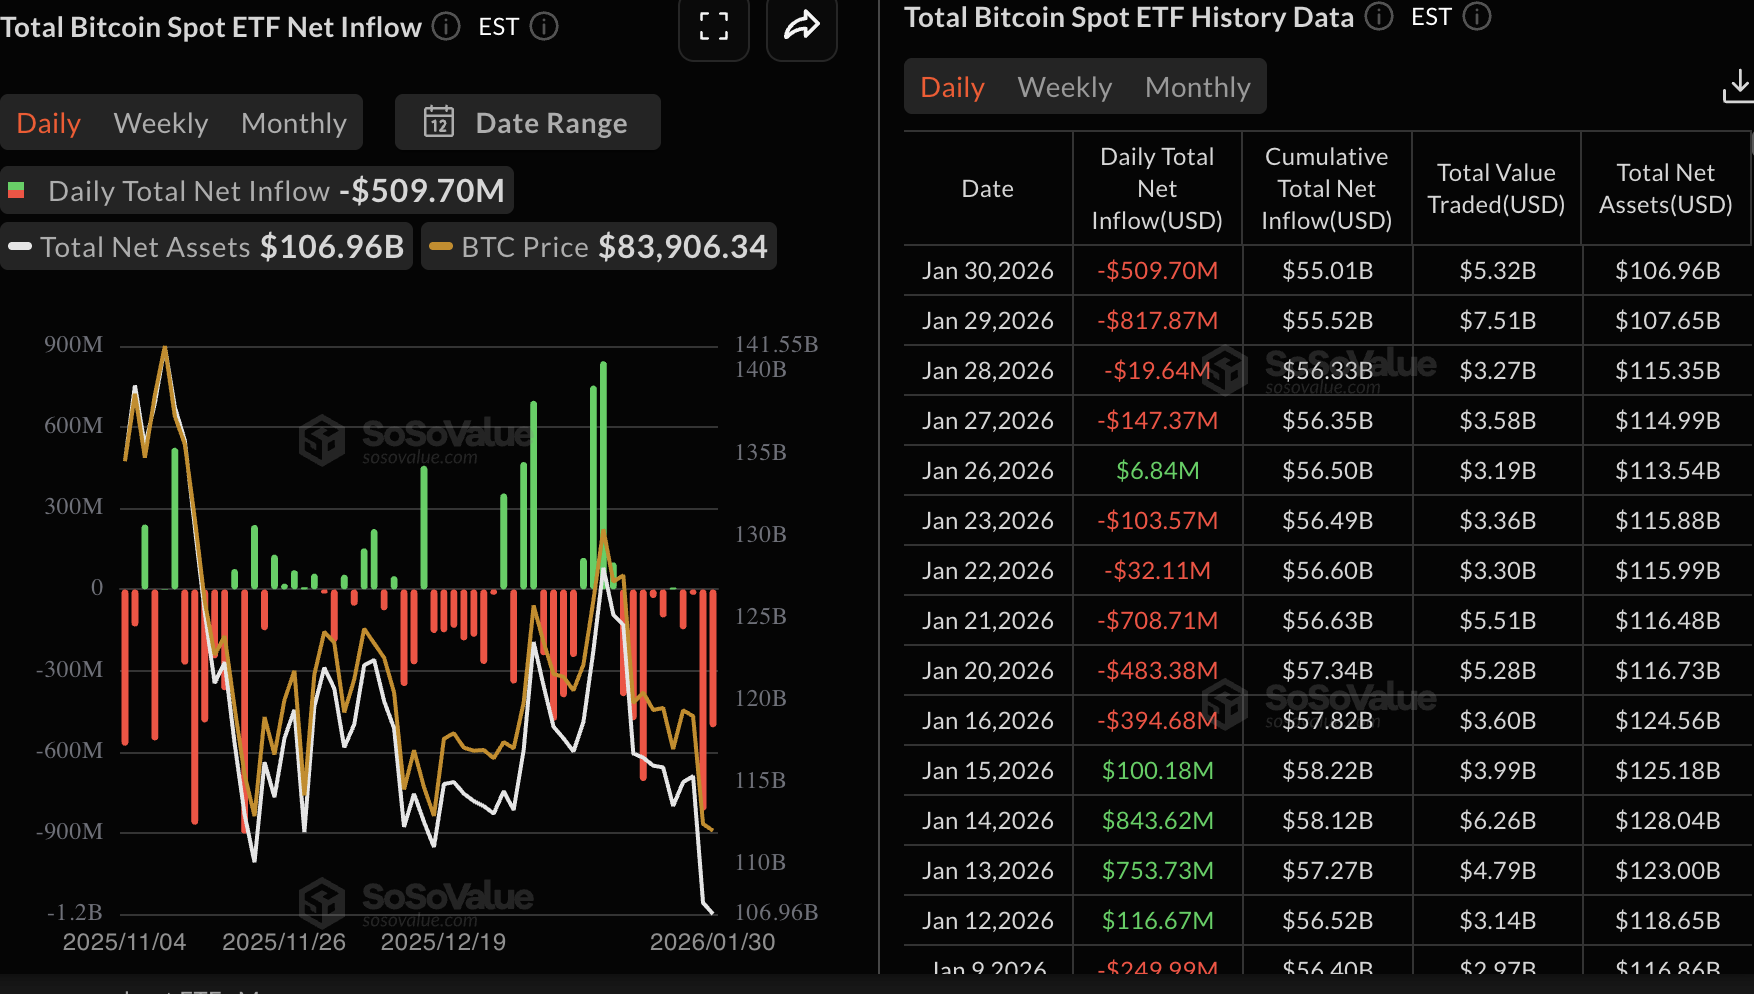
Investors continued to pull funds from Exchange-Traded Funds (ETFs), with outflows reaching approximately $510 million on Friday. SoSoValue data shows that outflows totalled $1.49 million last week, increasing from $1.33 million the previous week. The cumulative inflow stands at $55 billion with net assets under management at approximately $107 billion.
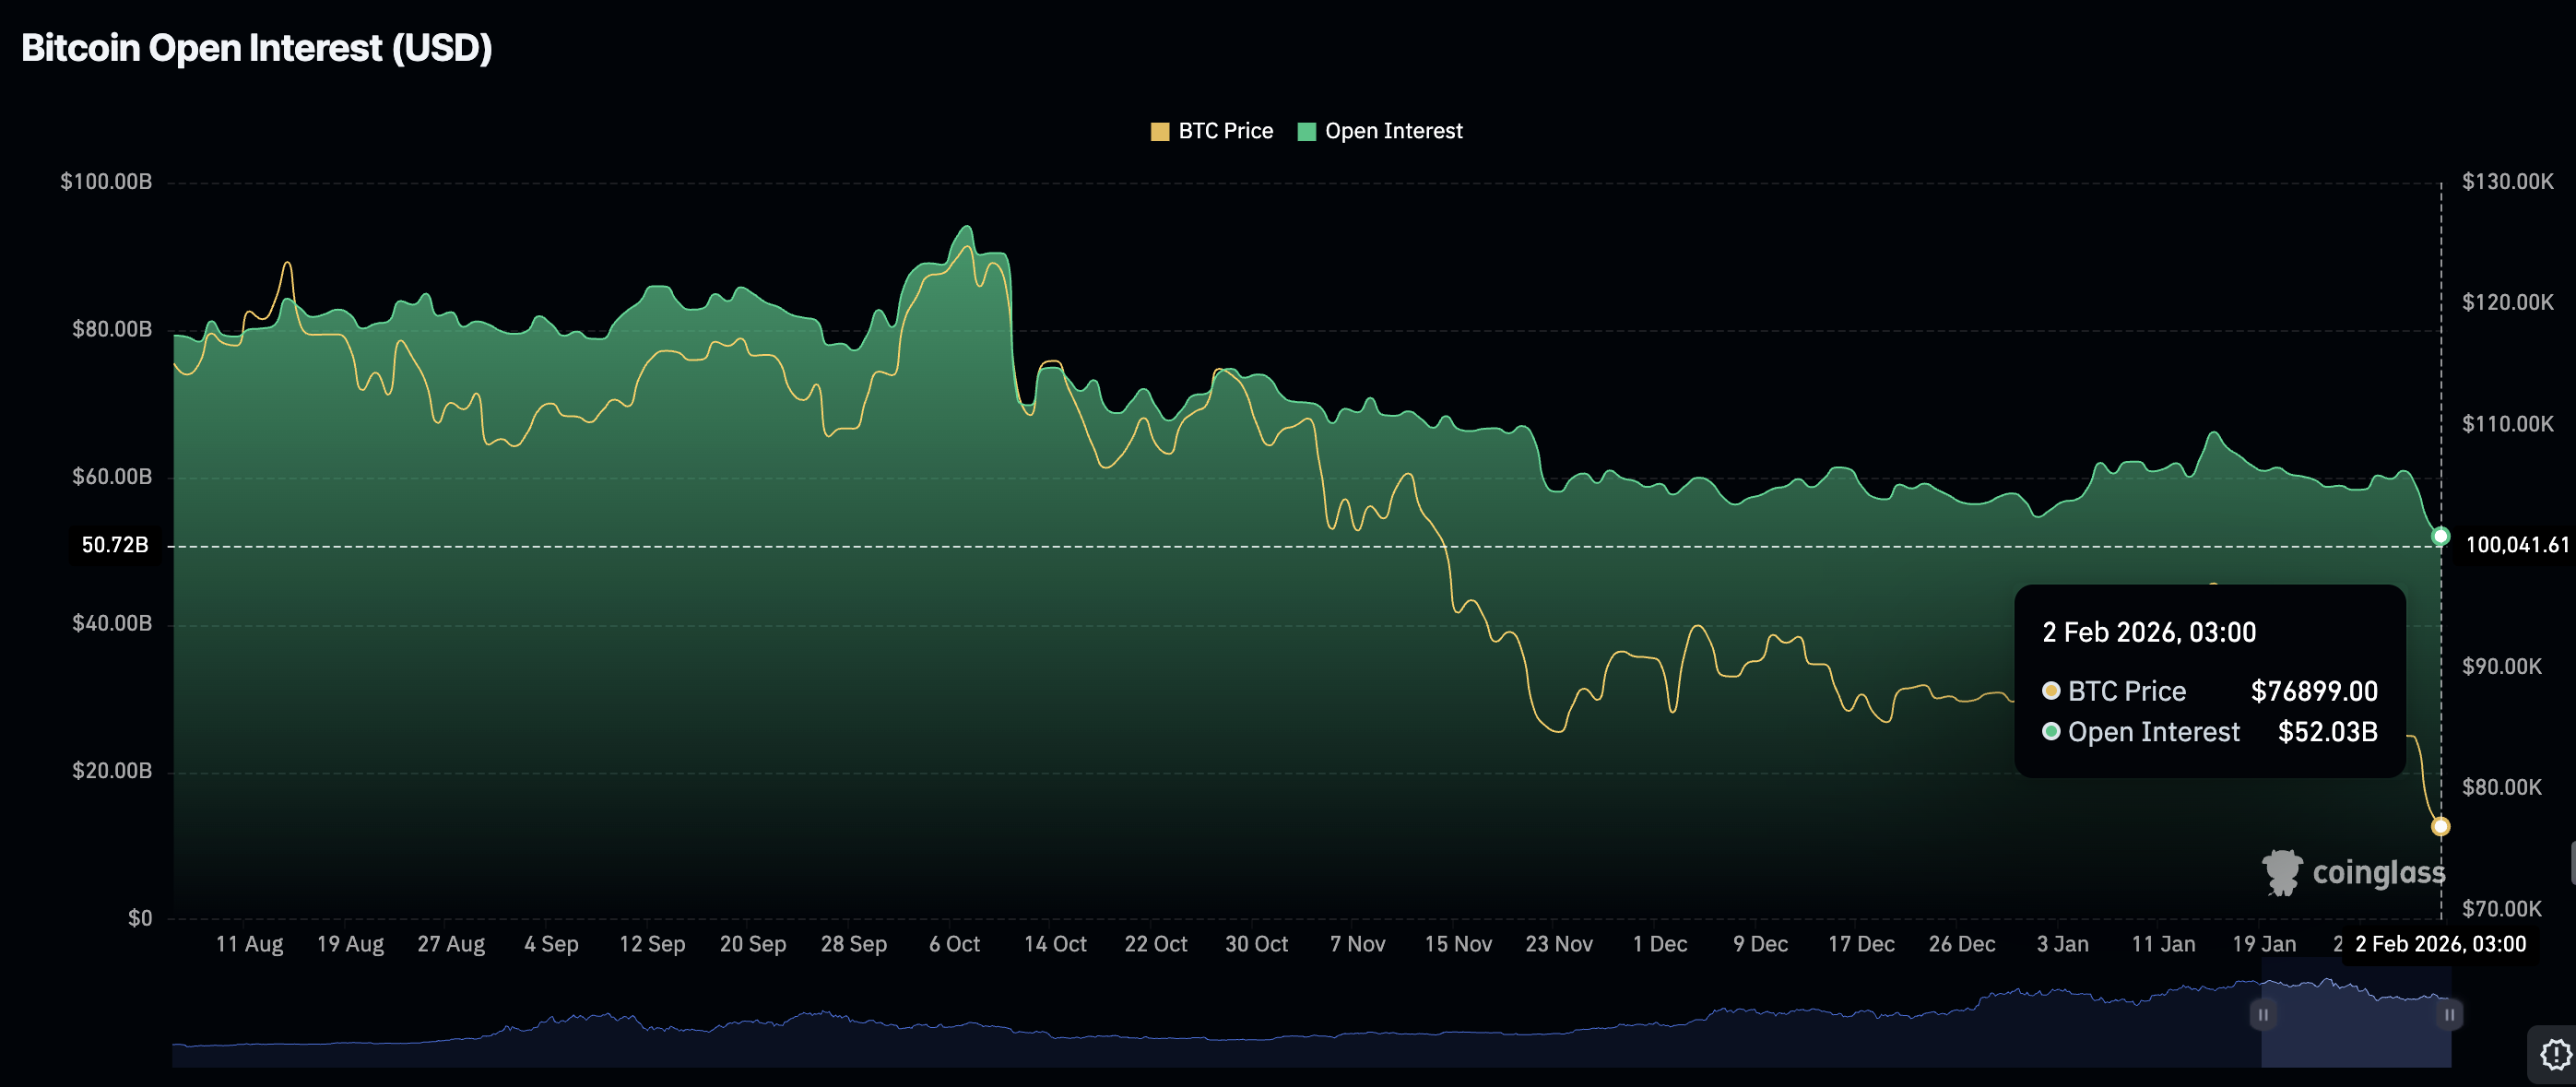
The derivatives market continues to weaken as Bitcoin futures Open Interest (OI) falls to $52.03 billion on Monday, from $54 billion the previous day and $61 billion on Friday. OI tracks the notional value of outstanding futures contracts; hence, low retail activity indicates that investors lack confidence in BTC’s ability to sustain an uptrend. It also means that investors are closing positions rather than opening new ones, depriving Bitcoin of the tailwind to recover.
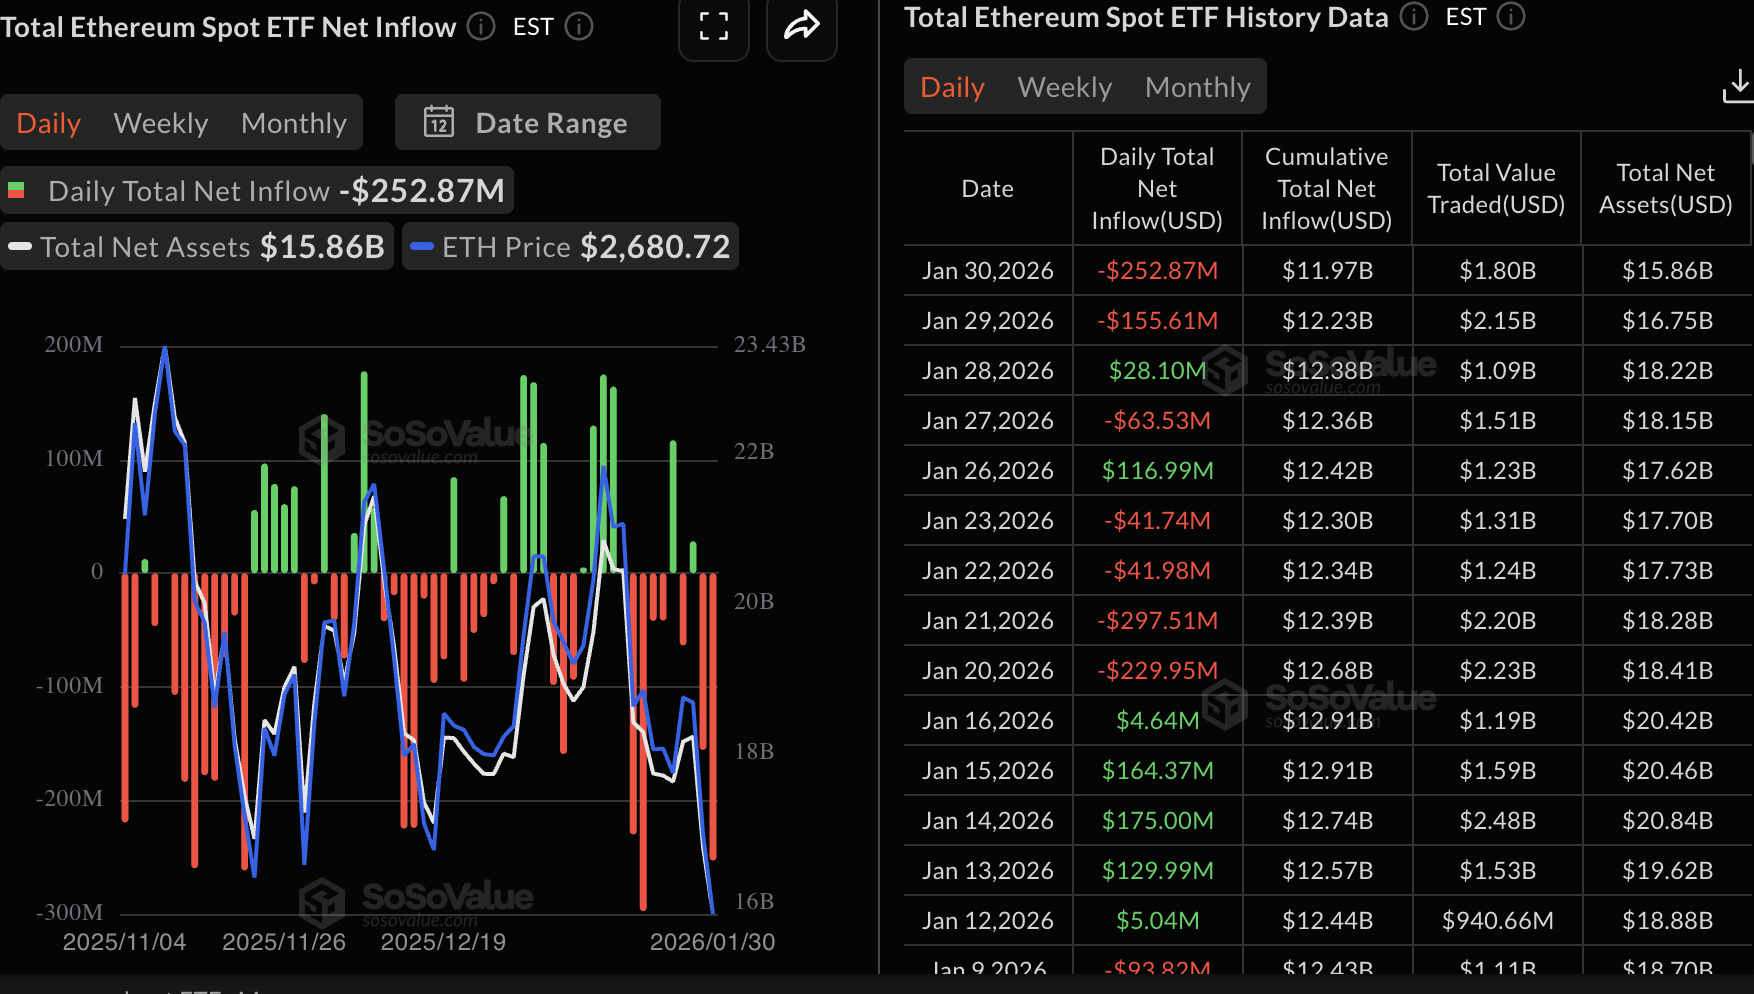
Ethereum, similarly, faces a significant drop in both institutional and retail interest, as outflows from US-listed spot ETFs rose to approximately $253 million on Friday from $156 million the previous day. The cumulative inflow stands at $11.97 billion with net assets under management at approximately $15.86 billion.
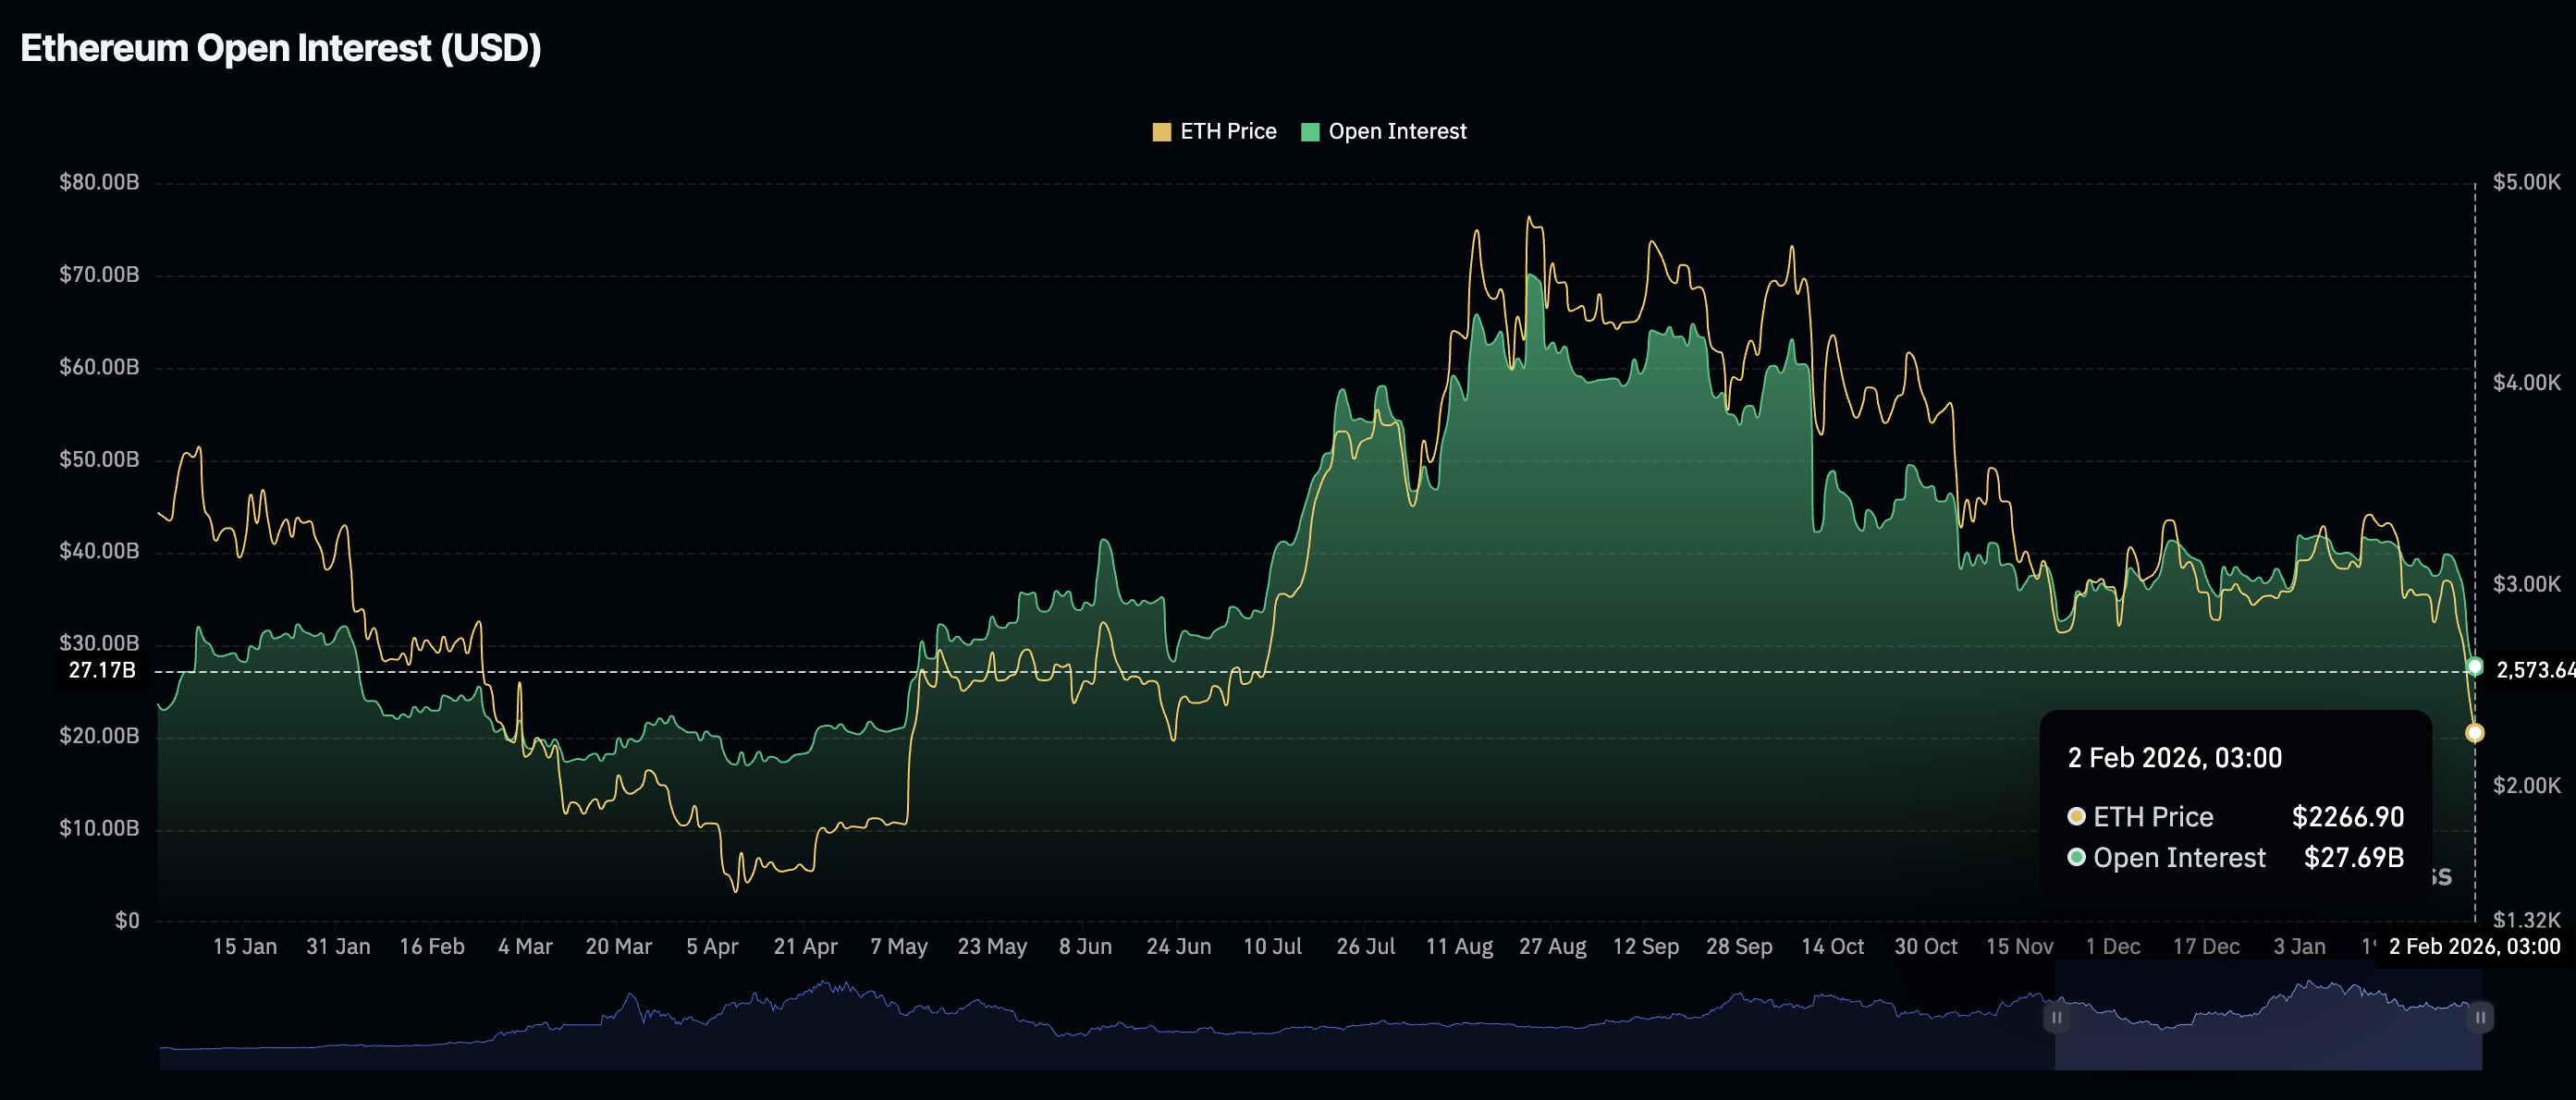
Retail interest in Ethereum remains low, as futures OI extends its correction to $27.69 billion on Monday from $29.67 billion the previous day. The OI traded at $38 billion on Friday, underscoring the sharp drop in speculative risk appetite.
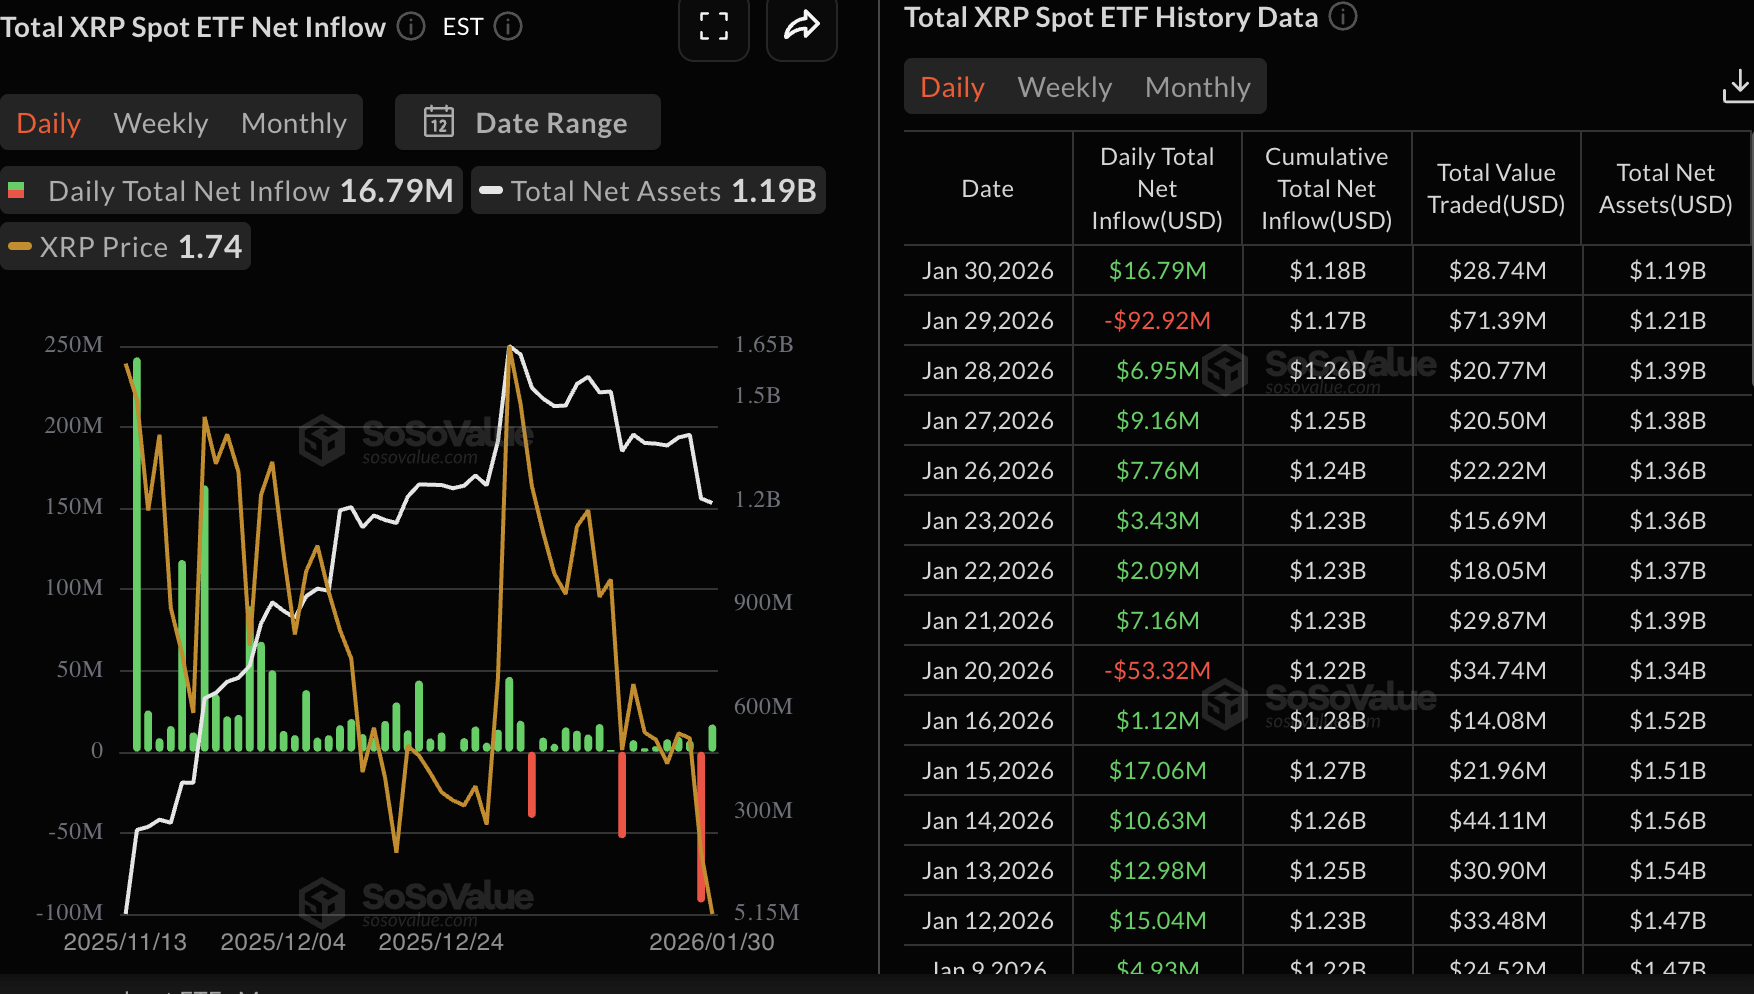
As for XRP, spot ETFs resumed inflows on Friday at nearly $17 million after recording the largest single-day outflow since launch of nearly $93 million on Thursday. The cumulative inflow currently stands at $1.18 billion, and net assets under management at $1.19 billion.
ETF flows serve as a gauge for market sentiment, with large or steady outflows indicating that investors lack confidence in XRP amid heightened Volatility.
Retail interest in XRP is evidently declining, as OI dropped to $2.81 billion on Monday, from $2.97 billion the previous day. Low retail activity indicates that investors lack confidence in the cross-border remittance token’s ability to sustain an uptrend, prompting them to sell.
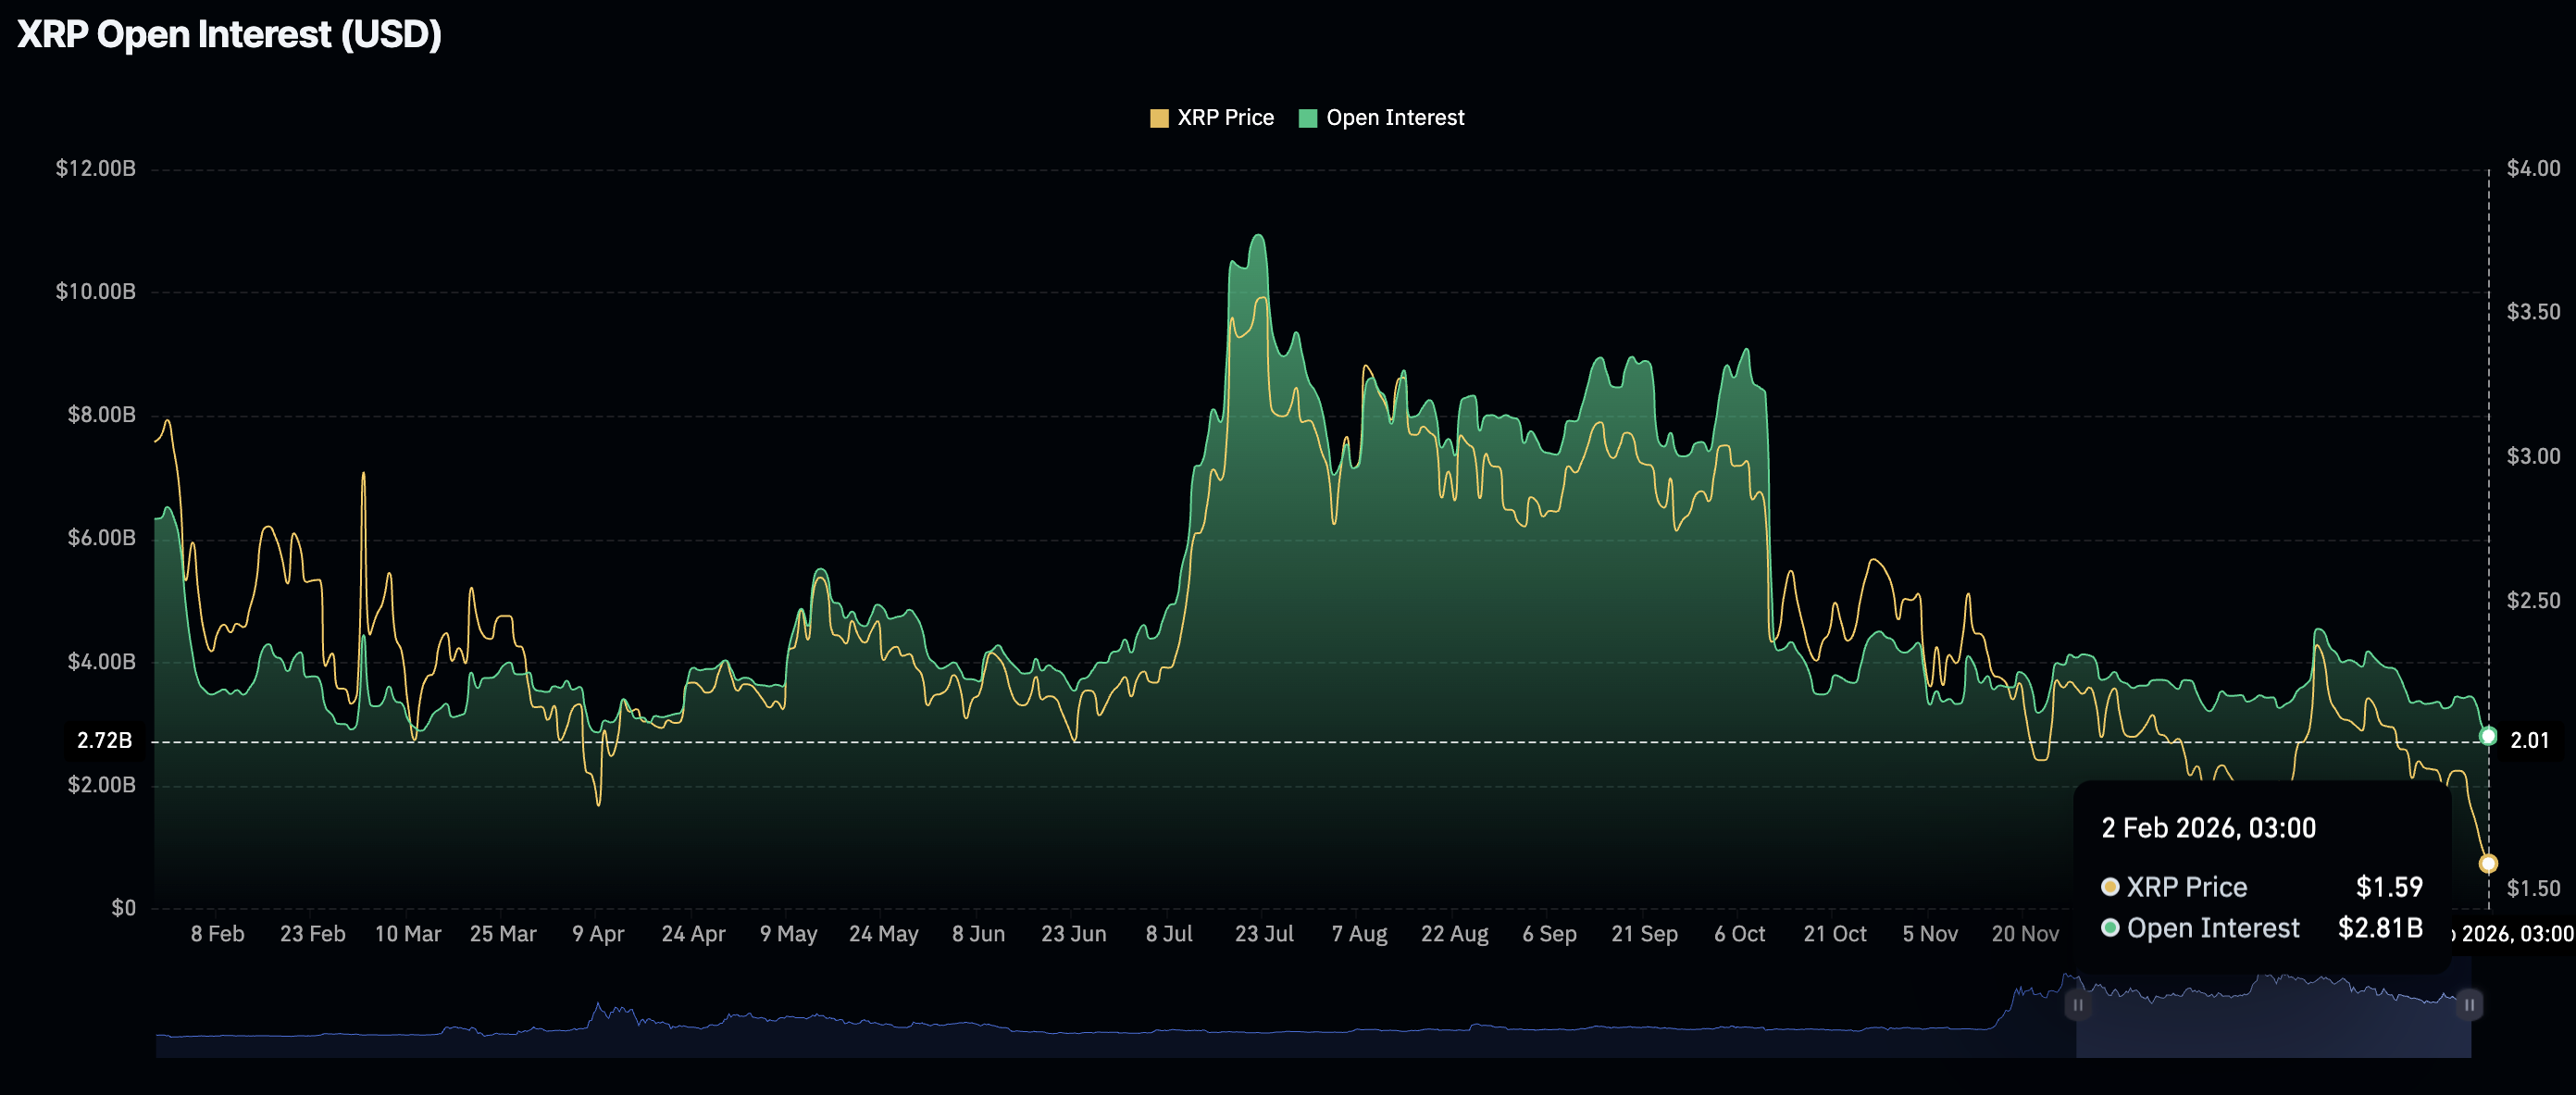
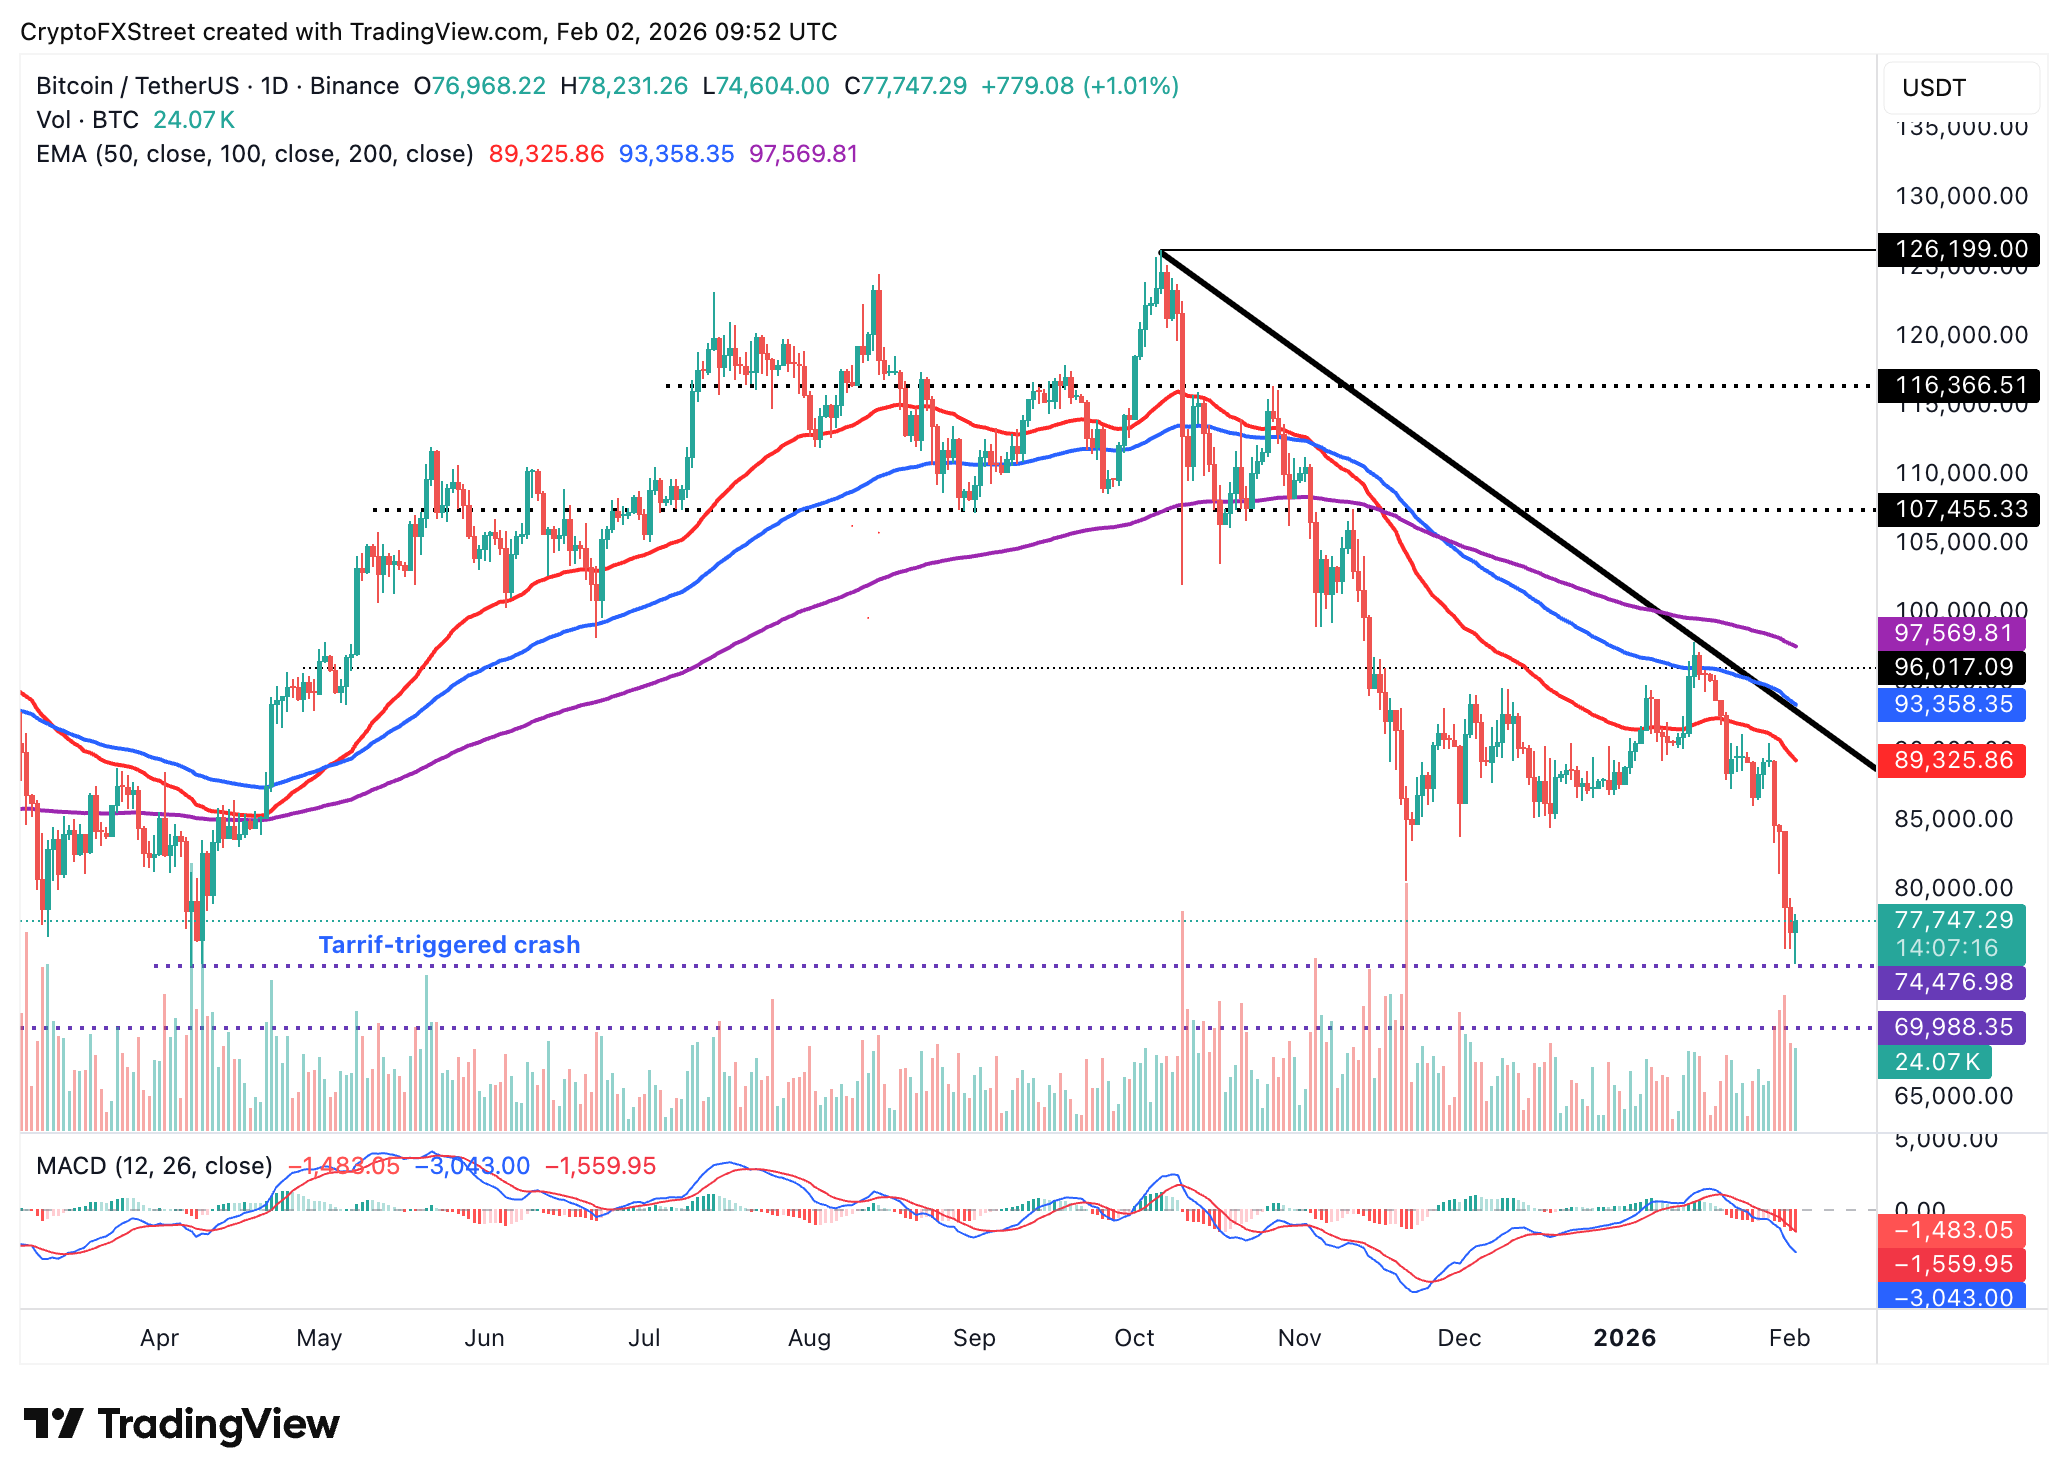
Chart of the day: Bitcoin consolidates amid weak technicals
Bitcoin remains above $77,000 as bulls push to regain momentum following last week’s sell-off. The demand zone at $74,476 provided the liquidity much-needed liquidity for a rebound. However, Bitcoin remains below the downtrending 50-day Exponential Moving Average (EMA) at $89,326, the 100-day EMA at $93,358 and the 200-day EMA at $97,570 amid an overall bearish trend.
The Moving Average Convergence Divergence (MACD) indicator is below its signal line on the daily chart, which could sustain the bearish outlook and prompt investors to reduce their exposure.
A reversal above $80,000 is on the cards if investors sense stability and declining volatility, with an extended push past the 50-day EMA likely to usher in a transition from bearish to bullish market conditions.
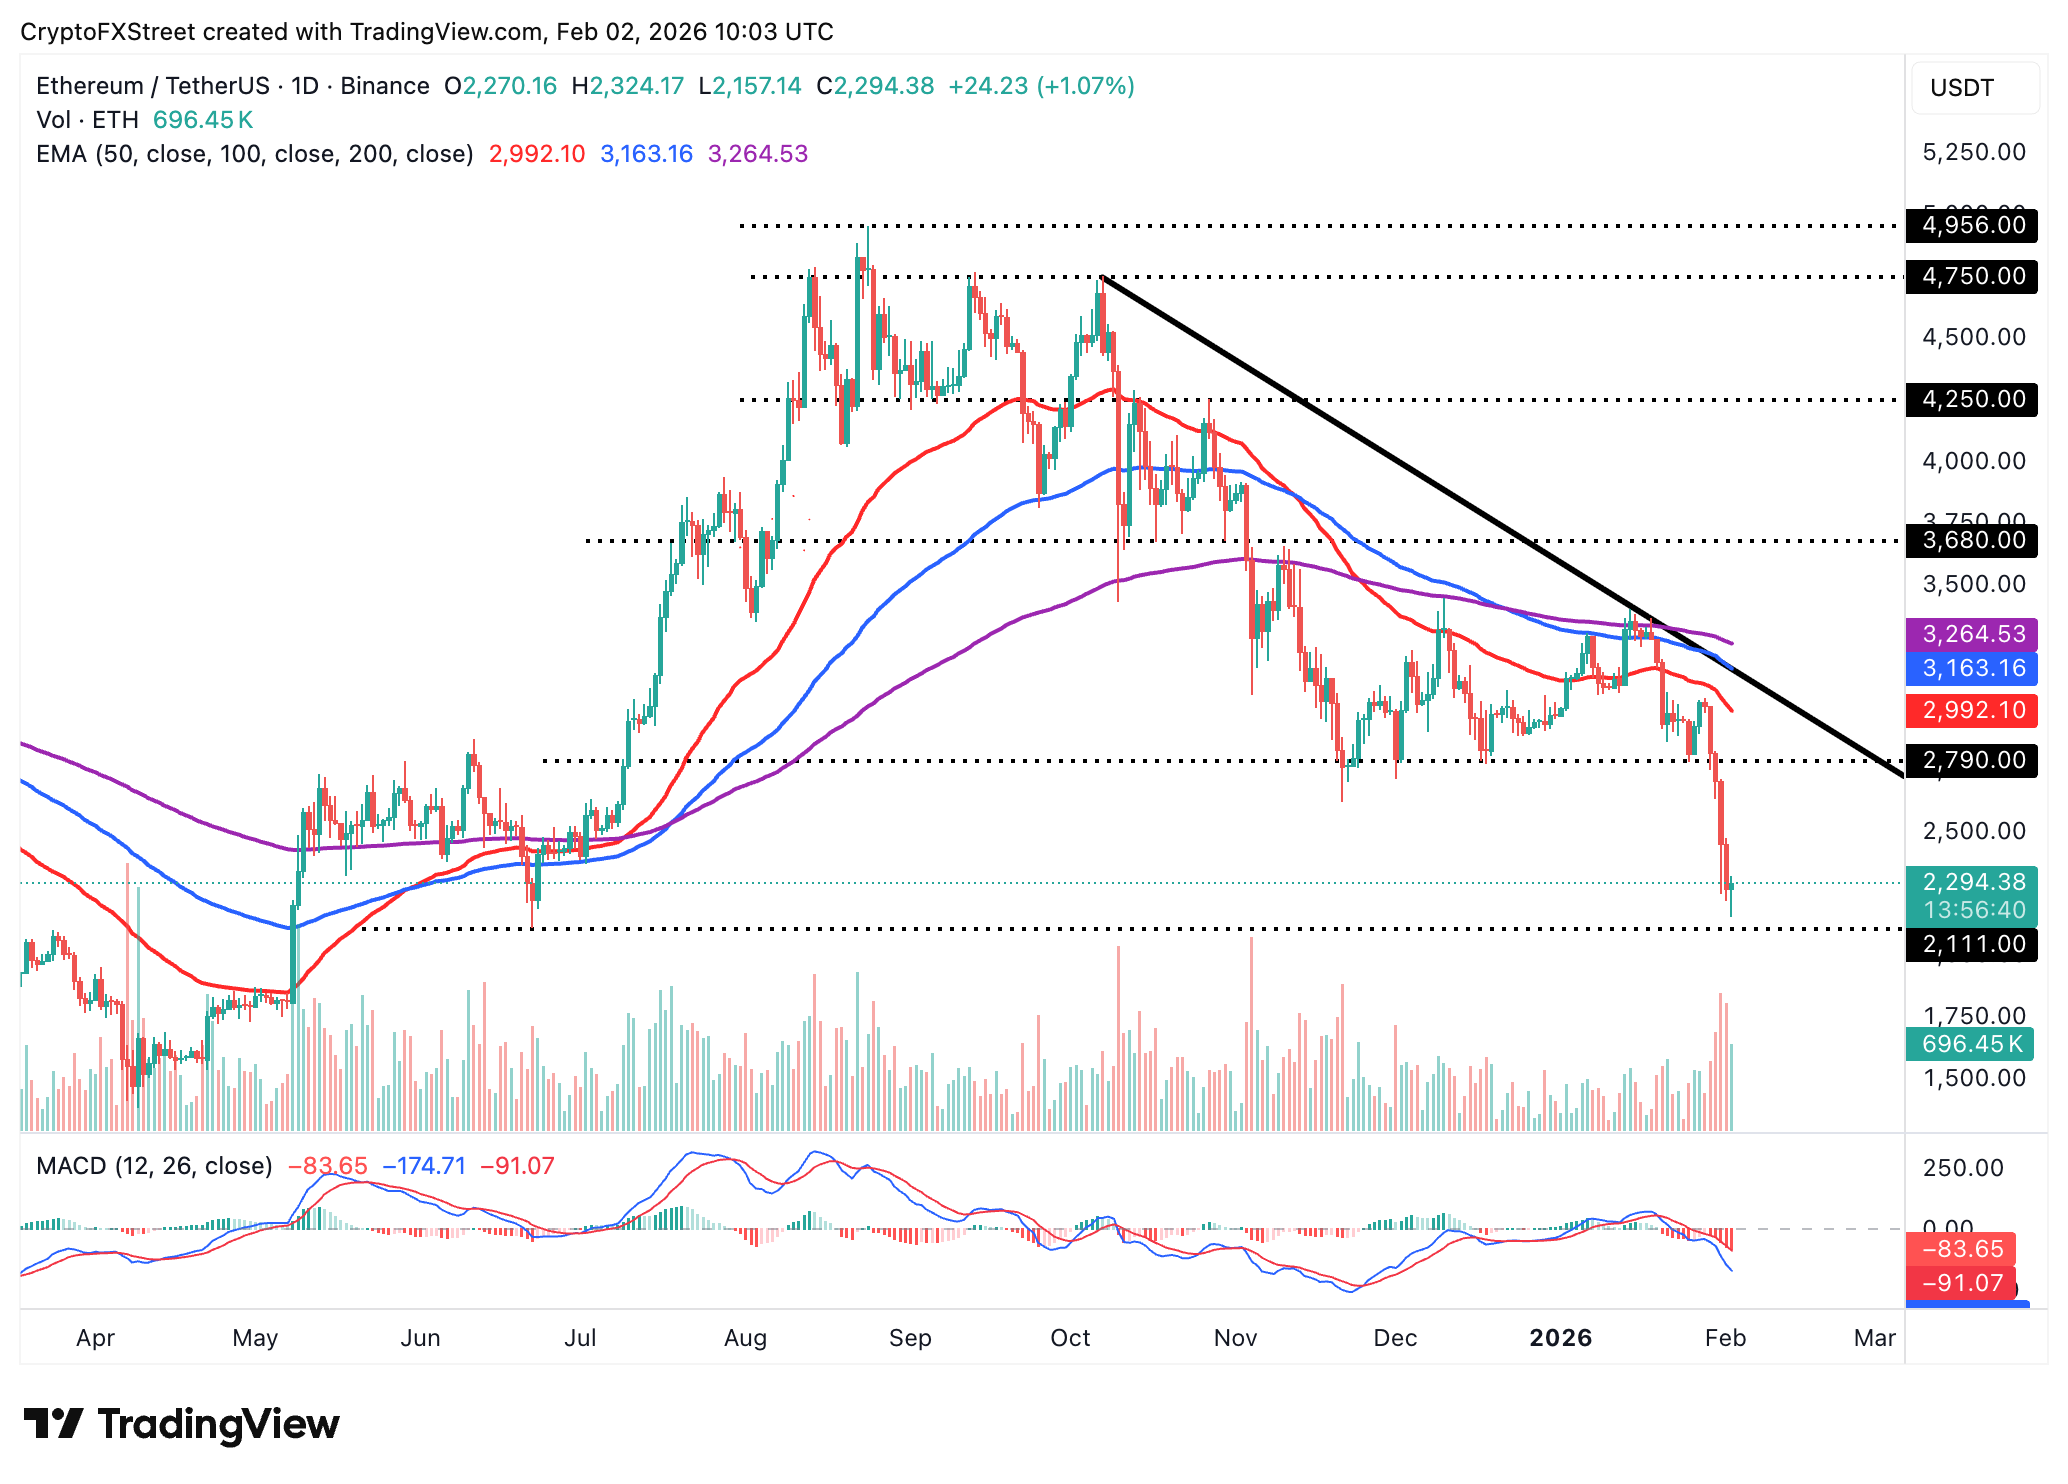
Altcoins technical outlook: Ethereum, XRP hold near key support
Ethereum is trading above $2,200 but below an immediate resistance at $2,300. The intraday low at $2,157 offers support. However, the overall trend remains largely bearish, as indicated by the MACD on the daily chart.
The MACD line below the signal line, along with the expanding red histogram bars, may keep traders in defence mode as they reduce risk exposure. If the support tested at $2,111 in June breaks, Ethereum could accelerate its decline below the pivotal $2,000 level.
As for XRP, bulls are attempting to take control and push the price above April’s support at $1.61. However, overhead pressure remains apparent, as the MACD indicator on the daily chart slides deeper below the signal line while red histogram bars expand, prompting traders to reduce their exposure to risk.
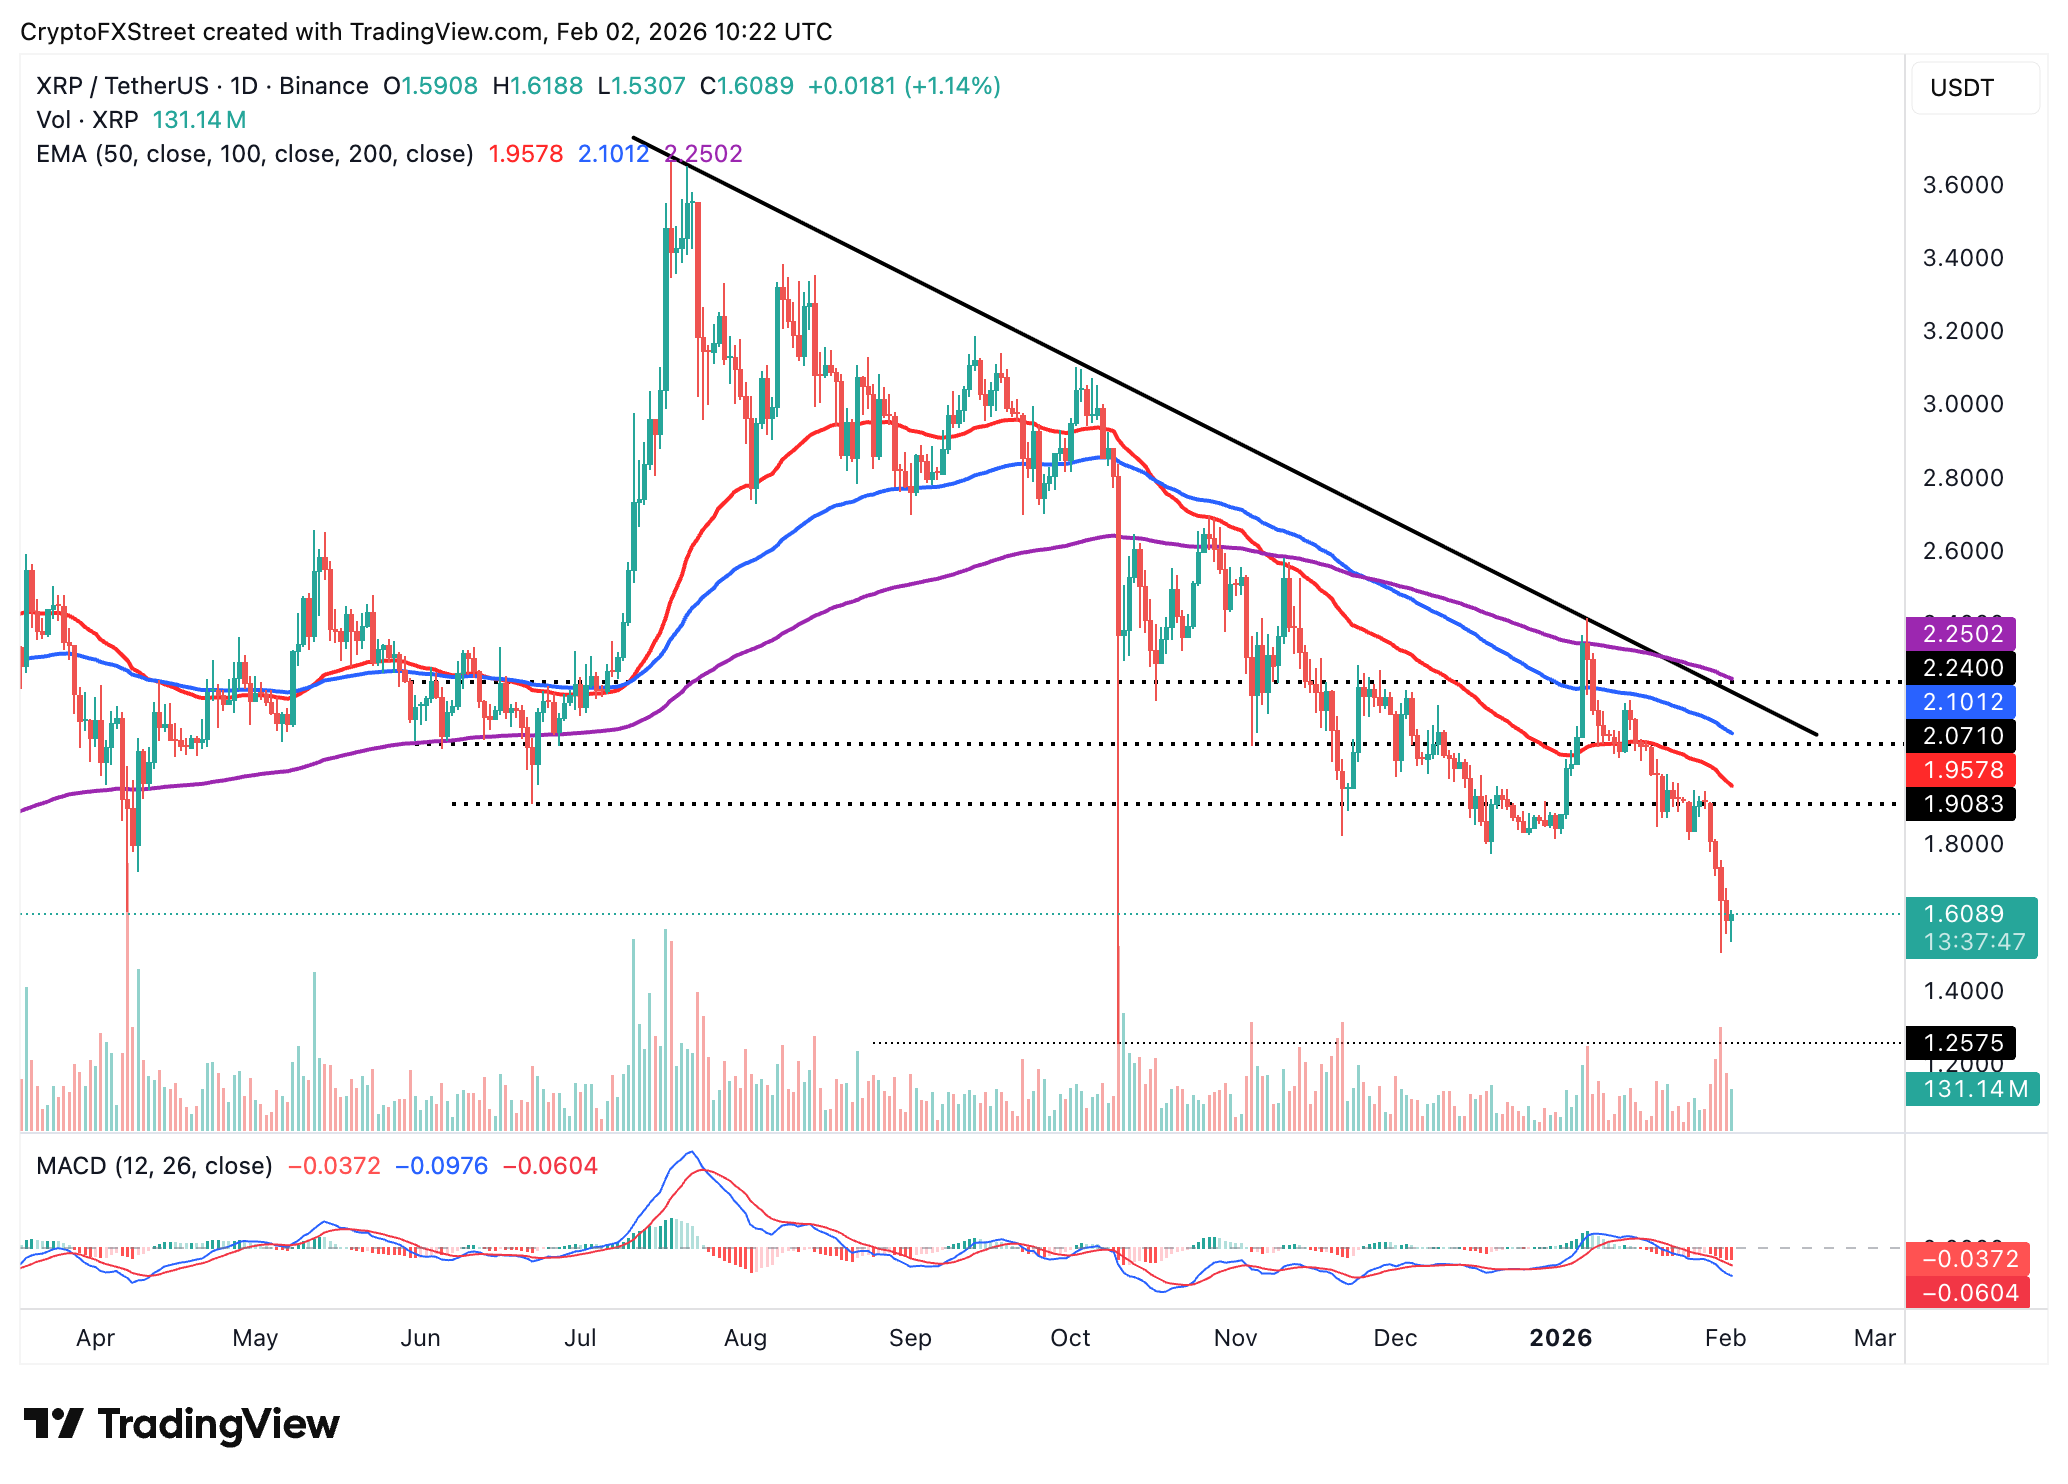
Closing below the support-turned-resistance at $1.61 could keep sellers in control, opening the door to the October 10 low at $1.25.
Crypto ETF FAQs
An Exchange-Traded Fund (ETF) is an investment vehicle or an index that tracks the price of an underlying asset. ETFs can not only track a single asset, but a group of assets and sectors. For example, a Bitcoin ETF tracks Bitcoin’s price. ETF is a tool used by investors to gain exposure to a certain asset.
Yes. The first Bitcoin futures ETF in the US was approved by the US Securities & Exchange Commission in October 2021. A total of seven Bitcoin futures ETFs have been approved, with more than 20 still waiting for the regulator’s permission. The SEC says that the cryptocurrency industry is new and subject to manipulation, which is why it has been delaying crypto-related futures ETFs for the last few years.
Yes. The SEC approved in January 2024 the listing and trading of several Bitcoin spot Exchange-Traded Funds, opening the door to institutional capital and mainstream investors to trade the main crypto currency. The decision was hailed by the industry as a game changer.
The main advantage of crypto ETFs is the possibility of gaining exposure to a cryptocurrency without ownership, reducing the risk and cost of holding the asset. Other pros are a lower learning curve and higher security for investors since ETFs take charge of securing the underlying asset holdings. As for the main drawbacks, the main one is that as an investor you can’t have direct ownership of the asset, or, as they say in crypto, “not your keys, not your coins.” Other disadvantages are higher costs associated with holding crypto since ETFs charge fees for active management. Finally, even though investing in ETFs reduces the risk of holding an asset, price swings in the underlying cryptocurrency are likely to be reflected in the investment vehicle too.
Nothing in this material constitutes investment advice, personal recommendation, investment research, an offer, or a solicitation to buy or sell any financial instrument. The content has been prepared without consideration of your individual investment objectives, financial situation, or needs, and should not be treated as such.
Past performance is not a reliable indicator of future performance and/or results. Forward-looking scenarios or forecasts are not a guarantee of future performance. Actual results may differ materially from those anticipated.
Mitrade makes no representation or warranty as to the accuracy or completeness of the information provided and accepts no liability for any loss arising from reliance on such information.
Recommended Articles


