

Dow Jones Industrial Average eases slightly as holiday slowdown stretches on
- The Dow shed around 100 points on a quiet Tuesday as markets shuffle their feet.
- Energy sector gains struggled to push back against declines in healthcare and financials.
- The Fed’s latest Meeting Minutes will serve as the final glimpse of the Fed’s discussions following its last rate cut.
The Dow Jones Industrial Average (DJIA) sagged on Tuesday, declining around 100 points as equities grapple with holiday-constrained market flows and low end-of-year trading volumes. Moderate gains in energy sector stocks were offset by softness in the healthcare and financial services sectors.
Stocks split down the middle, Dow eases
The Dow Jones softened by around 100 points, struggling to keep a hold of the 48,400 level, while the S&P 500 and the tech-heavy Nasdaq both held close to flat, splitting the middle on gainers and losers for the day. Boeing (BA) climbed 1.75% after winning a government contract to build and supply more F-15 fighter jets to Israel, and UnitedHealth Group (UNH) gained 0.75%. Goldman Sachs (GS) fell 1.2% on Tuesday, serving as a general bellwether for year-end risk appetite and throwing some caution signs for traders dabbling in low-volume trading, while biopharma giant Amgen (AMGN) fell a similar 1% on the day.
The Federal Reserve’s (Fed) latest Meeting Minutes from its last interest rate decision of the year will be released on Tuesday, and will give markets one last glimpse into the Fed’s internal policy discussions for 2025. The Fed’s last rate call, which saw the largest dissension among Federal Open Market Committee (FOMC) votes in six years, pushed a third straight interest rate cut onto markets. Rate traders now expect the Fed to stand pat until April.
Trump still wants to get rid of Powell early
US President Donald Trump has resumed his administrative policy approach of launching tirades against outgoing Fed Chair Jerome Powell. During a meeting with Israeli President Benjamin Netanyahu, Trump reiterated his stance that Fed Chair Powell is a “fool” and threatened to sue the head of the Fed for “gross incompetence”, mainly for not reducing interest rates as fast as Trump would personally like. Donald Trump tapped Jerome Powell as head of the Fed during his first term.
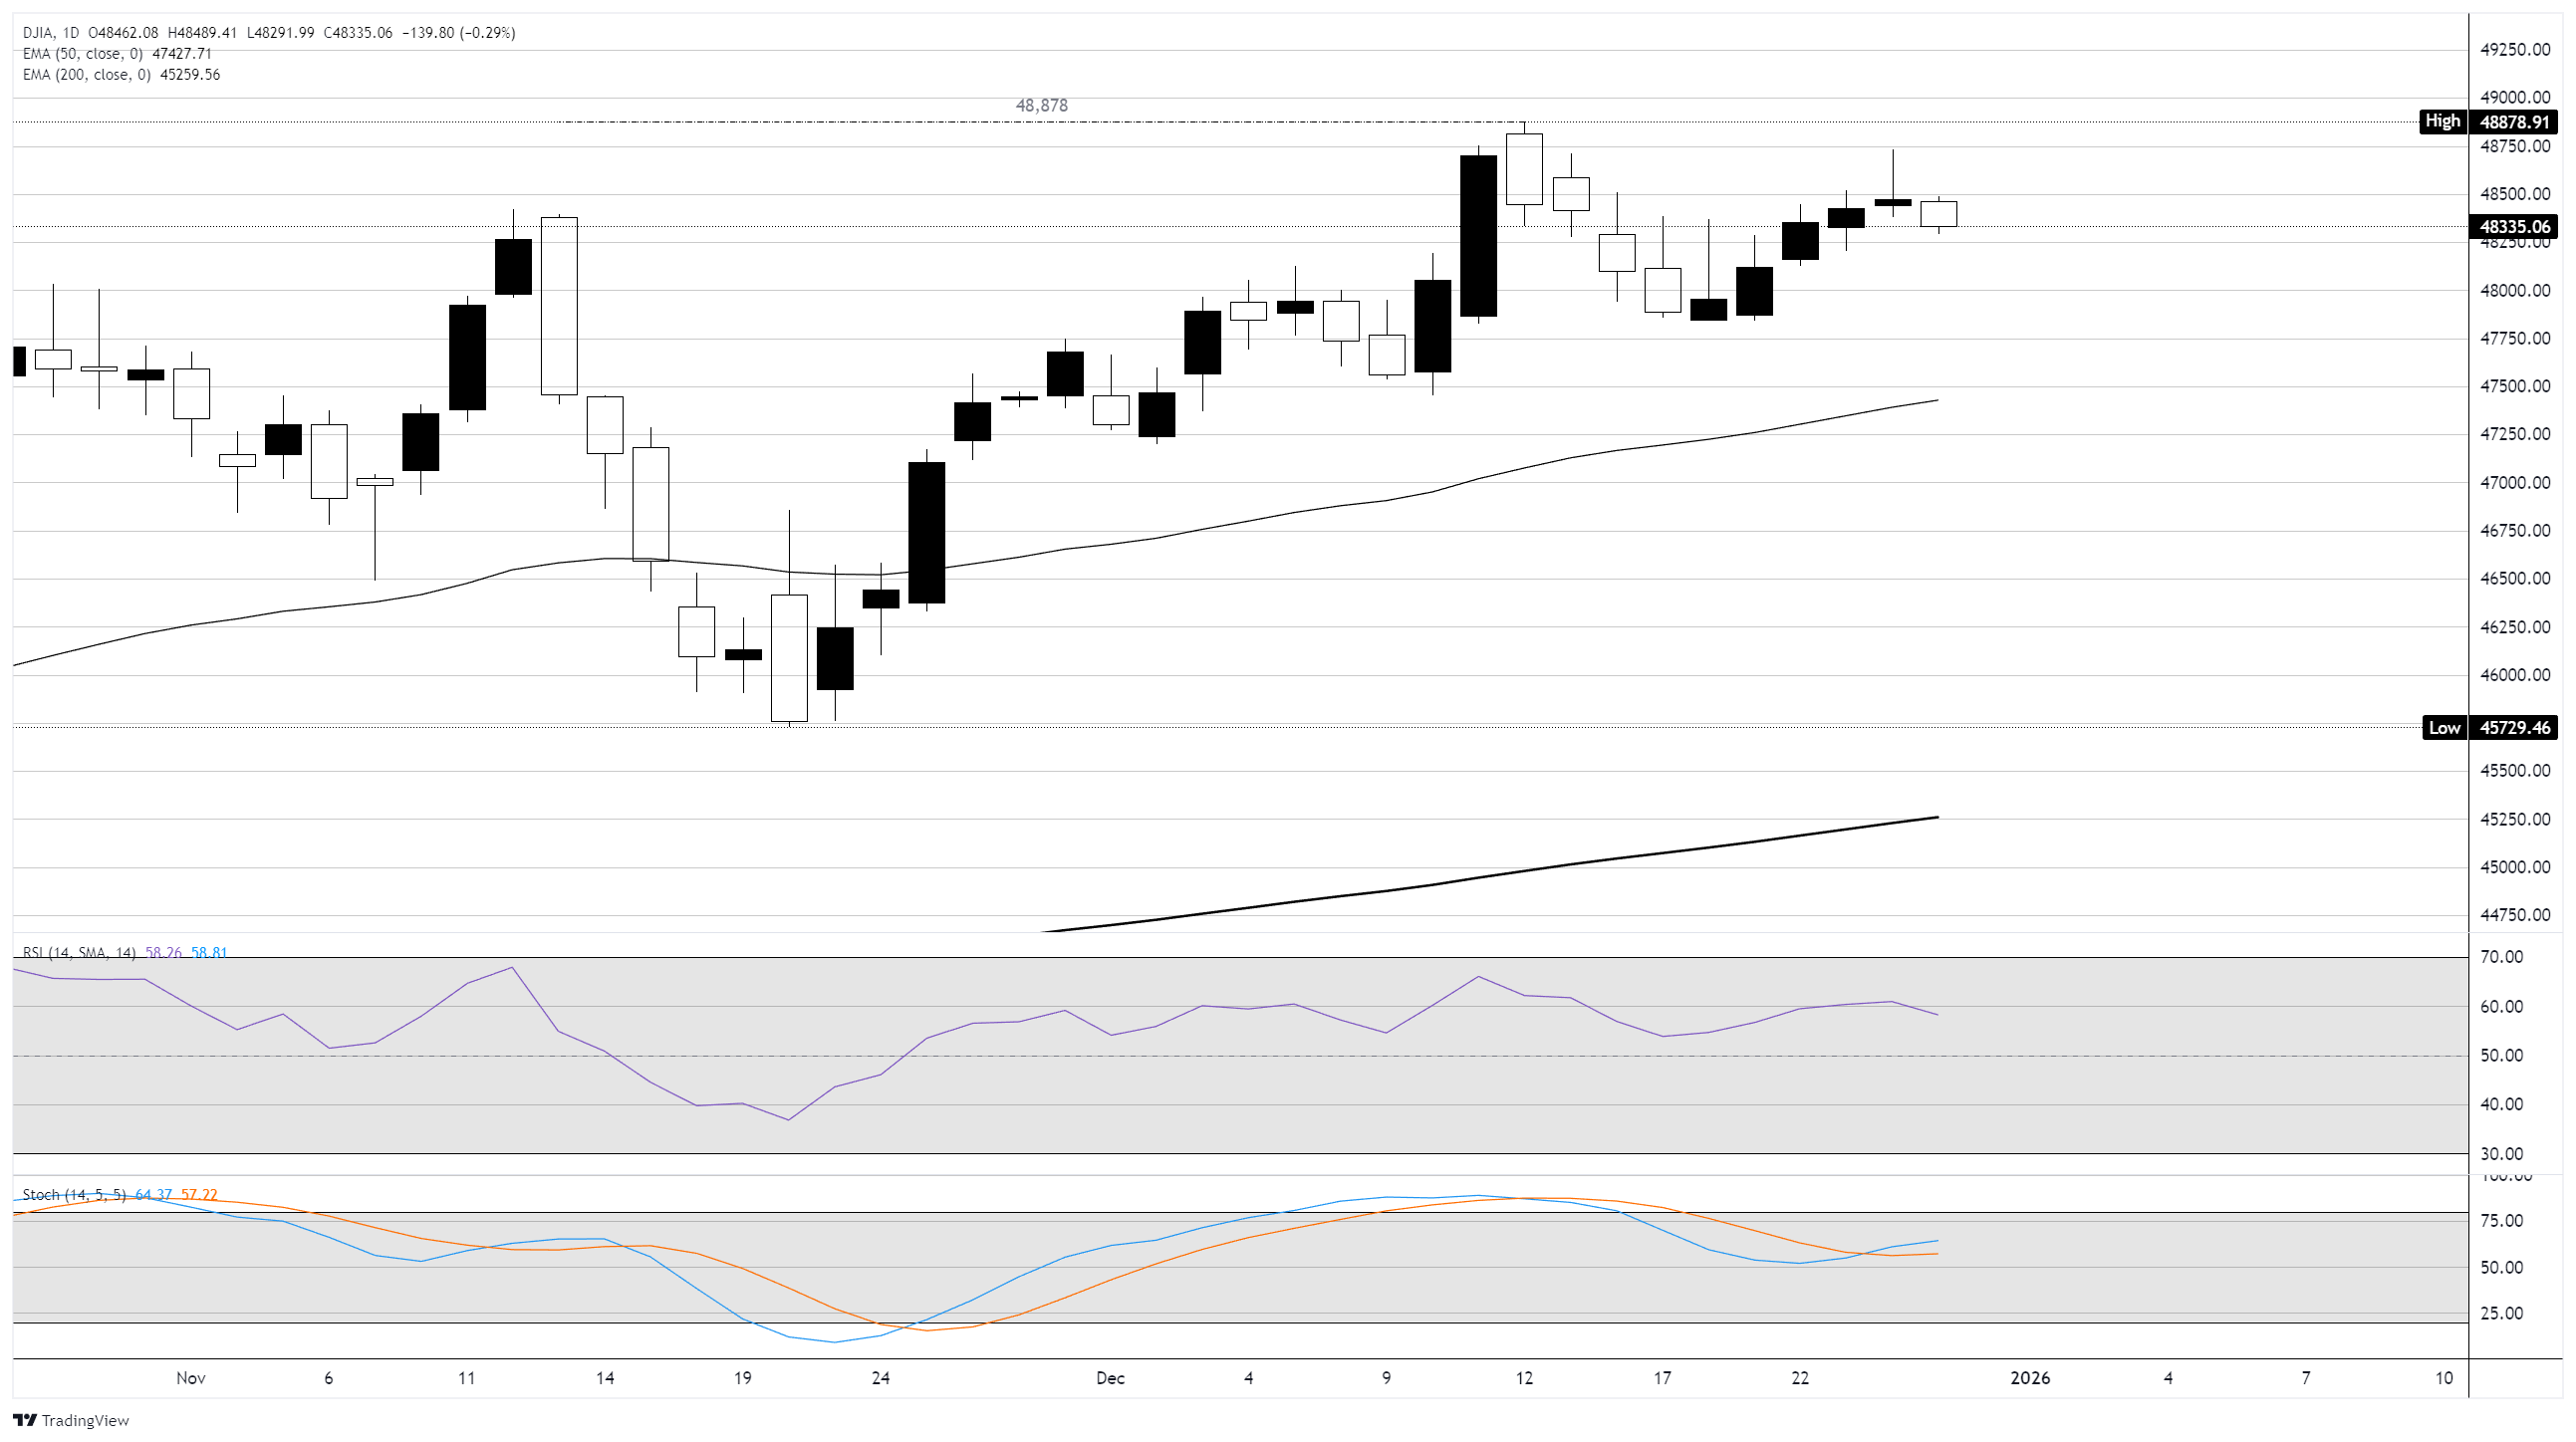
Dow Jones daily chart
Dow Jones FAQs
The Dow Jones Industrial Average, one of the oldest stock market indices in the world, is compiled of the 30 most traded stocks in the US. The index is price-weighted rather than weighted by capitalization. It is calculated by summing the prices of the constituent stocks and dividing them by a factor, currently 0.152. The index was founded by Charles Dow, who also founded the Wall Street Journal. In later years it has been criticized for not being broadly representative enough because it only tracks 30 conglomerates, unlike broader indices such as the S&P 500.
Many different factors drive the Dow Jones Industrial Average (DJIA). The aggregate performance of the component companies revealed in quarterly company earnings reports is the main one. US and global macroeconomic data also contributes as it impacts on investor sentiment. The level of interest rates, set by the Federal Reserve (Fed), also influences the DJIA as it affects the cost of credit, on which many corporations are heavily reliant. Therefore, inflation can be a major driver as well as other metrics which impact the Fed decisions.
Dow Theory is a method for identifying the primary trend of the stock market developed by Charles Dow. A key step is to compare the direction of the Dow Jones Industrial Average (DJIA) and the Dow Jones Transportation Average (DJTA) and only follow trends where both are moving in the same direction. Volume is a confirmatory criteria. The theory uses elements of peak and trough analysis. Dow’s theory posits three trend phases: accumulation, when smart money starts buying or selling; public participation, when the wider public joins in; and distribution, when the smart money exits.
There are a number of ways to trade the DJIA. One is to use ETFs which allow investors to trade the DJIA as a single security, rather than having to buy shares in all 30 constituent companies. A leading example is the SPDR Dow Jones Industrial Average ETF (DIA). DJIA futures contracts enable traders to speculate on the future value of the index and Options provide the right, but not the obligation, to buy or sell the index at a predetermined price in the future. Mutual funds enable investors to buy a share of a diversified portfolio of DJIA stocks thus providing exposure to the overall index.
Nothing in this material constitutes investment advice, personal recommendation, investment research, an offer, or a solicitation to buy or sell any financial instrument. The content has been prepared without consideration of your individual investment objectives, financial situation, or needs, and should not be treated as such.
Past performance is not a reliable indicator of future performance and/or results. Forward-looking scenarios or forecasts are not a guarantee of future performance. Actual results may differ materially from those anticipated.
Mitrade makes no representation or warranty as to the accuracy or completeness of the information provided and accepts no liability for any loss arising from reliance on such information.
Recommended Articles


