CFDs are complex instruments and come with a high risk of losing money rapidly due to leverage. 74% of retail investor accounts lose money when trading CFDs with this provider. You should consider whether you understand how CFDs work and whether you can afford to take the high risk of losing your money.

Algorand Price Forecast: ALGO eyes further upside as falling-wedge retest holds

Source Fxstreet
  • Algorand price is nearing the previously broken falling-wedge trendline on Thursday, if holds, suggests rally continuation.
  • On-chain and derivatives data support bullish sentiment, with TVL rising alongside large whale orders and positive funding rates.
  • The technical outlook suggests further upside, with bulls targeting levels above $0.150.

Algorand (ALGO) price steadies around $0.136 on Thursday, nearing a key support level; if it holds, it suggests further upside. Bullish sentiment strengthens as ALGO’s on-chain and derivatives data indicate improving trader sentiment. The technical outlook remains constructive, with bulls targeting a move above $0.150 in the near term.

Algorand’s on-chain and derivatives data show improving sentiment

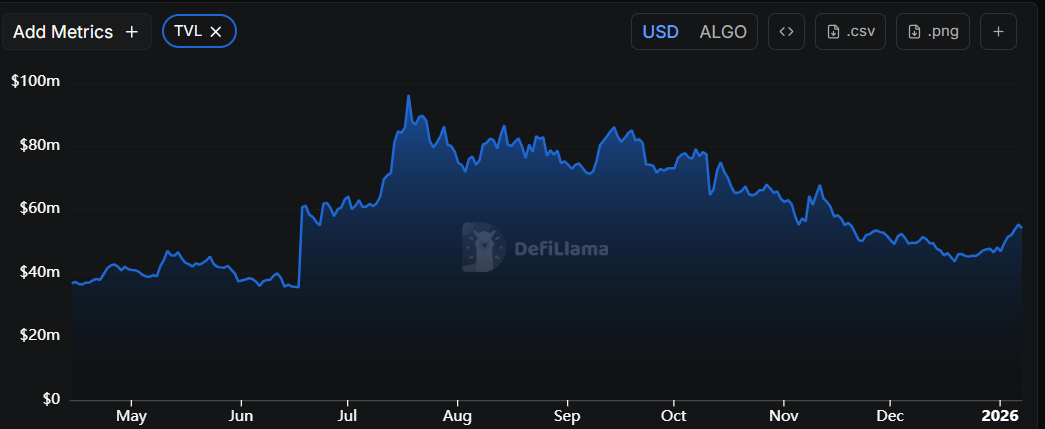
DefiLlama data shows that Algorand's Total Value Locked (TVL) has been steadily rising since mid-December and currently stands at $54.70 million. This increase in TVL indicates growing activity and interest in Algorand’s ecosystem, suggesting that more users are depositing or using assets on ALGO-based protocols.

ALGO TVL chart. Source: DefiLlama

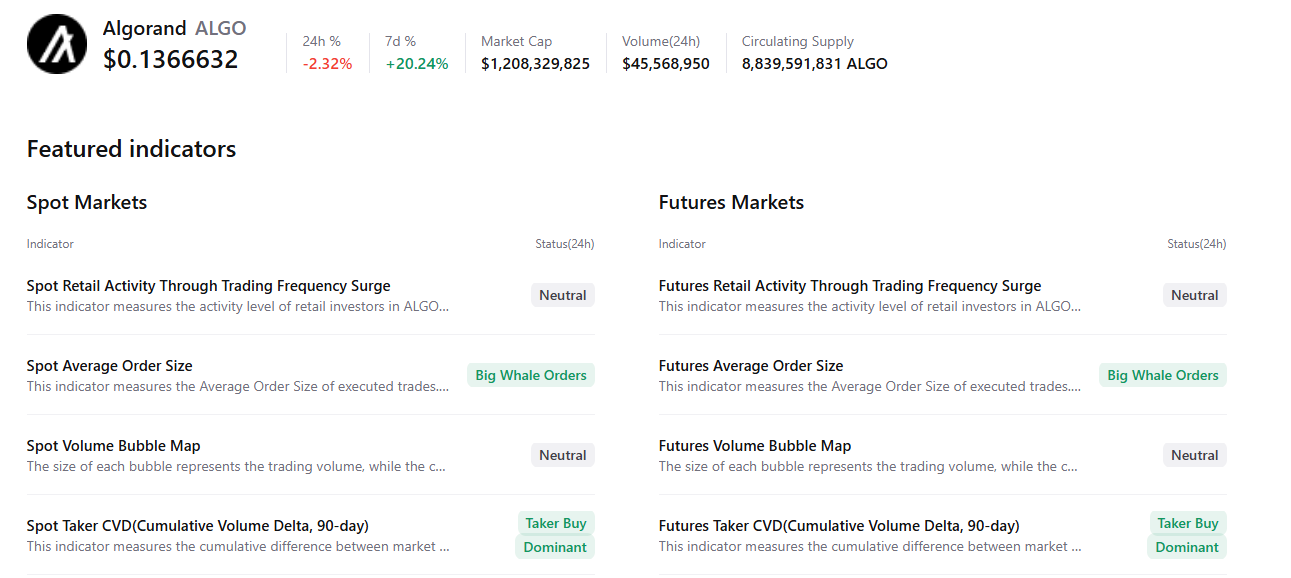
In addition, CryptoQuant’s summary data also supports the positive outlook, as ALGO’s spot and futures markets show large whale orders and buy dominance, signaling a potential rally in the upcoming days.

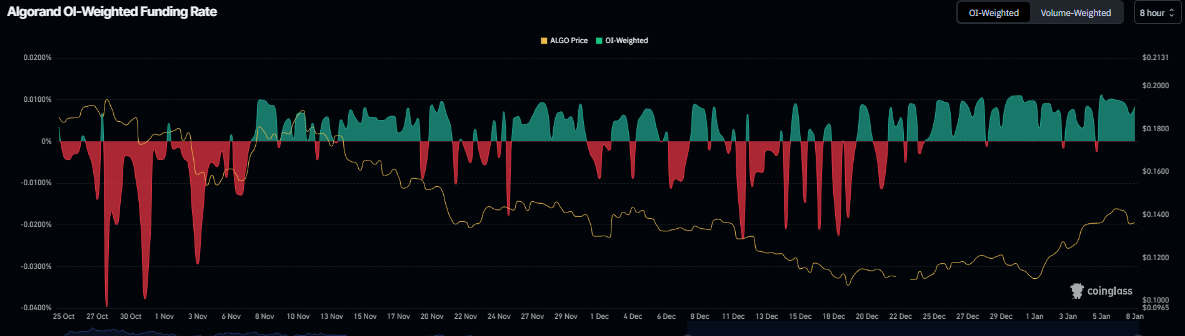
On the derivatives side, Algorand funding rates support a bullish bias. Coinglass’s OI-Weighted Funding Rate data shows that the number of traders betting that the price of ALGO will slide further is lower than those anticipating a price increase.

The metric flipped positive on Monday and rose to 0.0084% on Thursday, indicating that longs are paying shorts. Historically, when the funding rates have flipped from negative to positive and increased, Algorand’s price has rallied sharply.

Algorand funding rate chart. Source: Coinglass

Algorand Price Forecast: ALGO could rally if key support holds

Algorand's price broke above the falling wedge pattern (formed by connecting multiple highs and lows with two trendlines since early August) on Sunday and rose nearly 5% over the next two days. However, ALGO declined slightly mid-week and as of Thursday, is near the previously broken trendline.

If the trendline, which roughly coincides with the 50-day Exponential Moving Average (EMA) at $0.133, holds as support, ALGO could extend the rally toward the next daily resistance at $0.152. A successful close above this level could extend additional gains toward the next key resistance at $0.186.

The Relative Strength Index (RSI) on the daily chart reads 59, above the neutral level of 50, indicating bullish momentum is gaining traction. In addition, the Moving Average Convergence Divergence (MACD) indicator shows a bullish crossover and rising green histogram bars above the neutral level, further supporting the bullish outlook.

ALGO/USDT daily chart

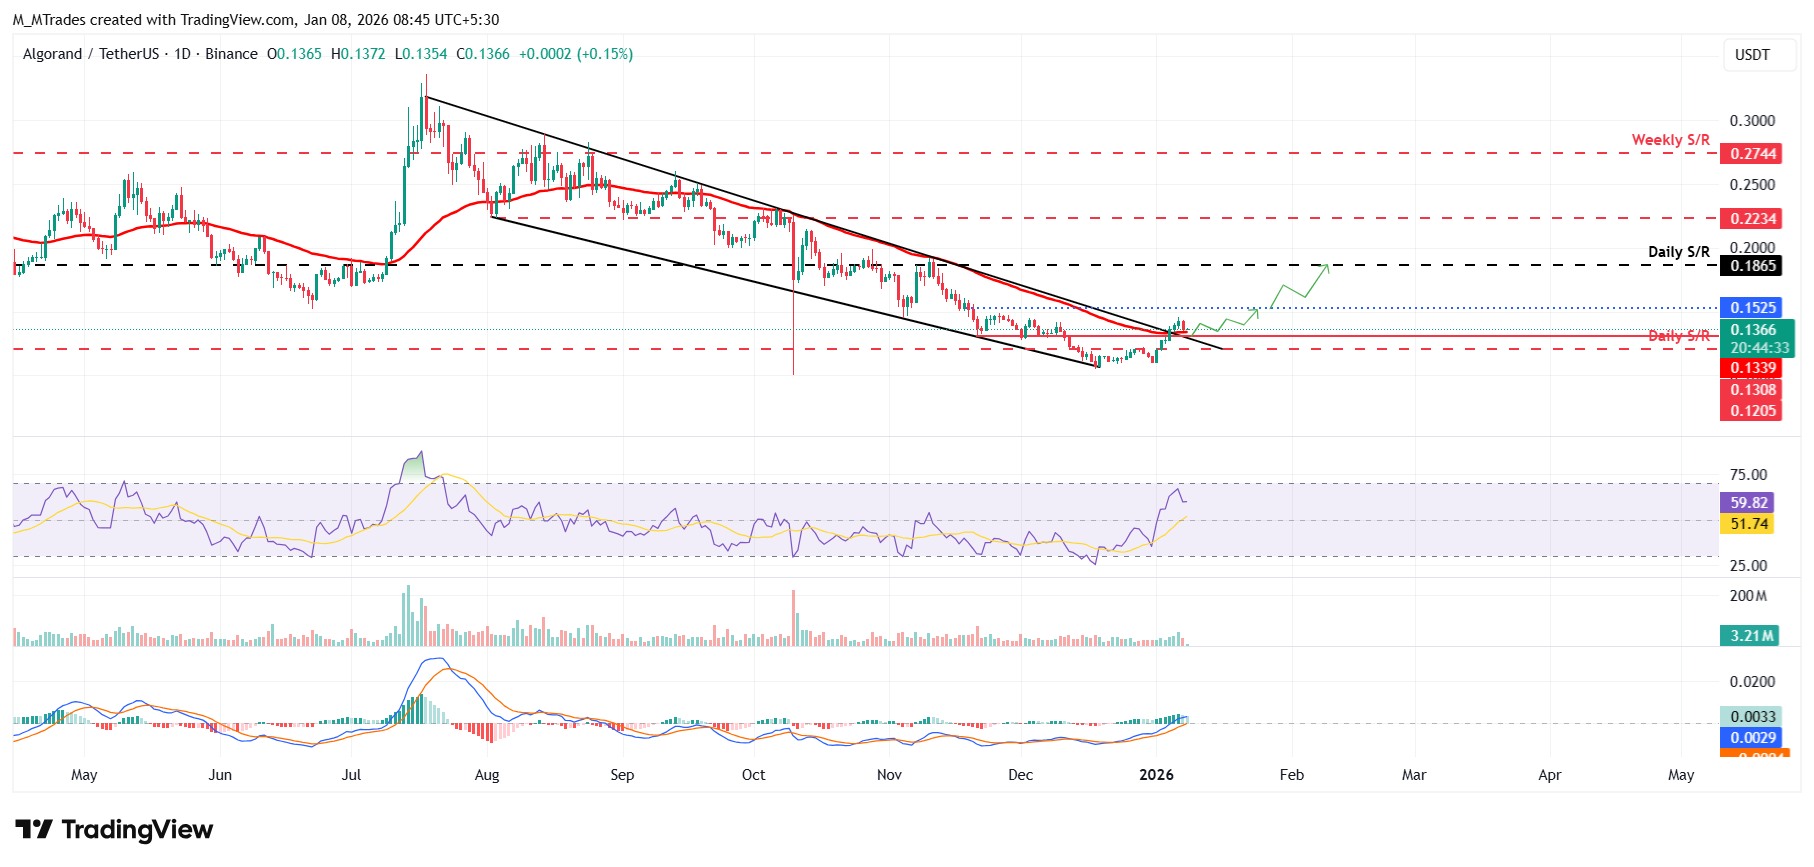
However, if the trendline fails to hold, ALGO could extend the decline toward the daily support at $0.120.

Disclaimer: The content available on Mitrade Insights is provided for informational and marketing purposes only. It has not been prepared in accordance with legal requirements designed to promote the independence of investment research and is not subject to any prohibition on dealing ahead of the dissemination of investment research
Nothing in this material constitutes investment advice, personal recommendation, investment research, an offer, or a solicitation to buy or sell any financial instrument. The content has been prepared without consideration of your individual investment objectives, financial situation, or needs, and should not be treated as such.
Past performance is not a reliable indicator of future performance and/or results. Forward-looking scenarios or forecasts are not a guarantee of future performance. Actual results may differ materially from those anticipated.
Mitrade makes no representation or warranty as to the accuracy or completeness of the information provided and accepts no liability for any loss arising from reliance on such information.
placeholder
WTI hovers below $59.00 as US-Iran tensions ease, weekly loss loomsWest Texas Intermediate (WTI) Oil price moves little after two days of more than 3% losses, trading around $58.80 during the Asian hours on Friday. WTI price faces challenges as geopolitical risk premiums faded following easing fears of a possible US military strike on Iran.
Author  FXStreet
14 hours ago
West Texas Intermediate (WTI) Oil price moves little after two days of more than 3% losses, trading around $58.80 during the Asian hours on Friday. WTI price faces challenges as geopolitical risk premiums faded following easing fears of a possible US military strike on Iran.
placeholder
Cardano Price Forecast: Rejection at 50-day EMA tightens bearish gripCardano (ADA) edges lower by over 3% at press time on Thursday, extending the second rejection from the 50-day Exponential Moving Average (EMA) so far this month. A bearish side in the retail interest leads to a decline in Open Interest and lowered funding rates.
Author  FXStreet
Yesterday 07: 55
Cardano (ADA) edges lower by over 3% at press time on Thursday, extending the second rejection from the 50-day Exponential Moving Average (EMA) so far this month. A bearish side in the retail interest leads to a decline in Open Interest and lowered funding rates.
placeholder
Hedera Price Forecast: HBAR extends gains as ETF inflows boost sentiment Hedera (HBAR) is trading at around $0.127 on Wednesday, approaching a key resistance level; a breakout above this level would signal further gains. Institutional demand continues to strengthen this week, with spot HBAR Exchange-Traded Funds (ETFs) recording three consecutive days of inflows.
Author  FXStreet
Jan 14, Wed
Hedera (HBAR) is trading at around $0.127 on Wednesday, approaching a key resistance level; a breakout above this level would signal further gains. Institutional demand continues to strengthen this week, with spot HBAR Exchange-Traded Funds (ETFs) recording three consecutive days of inflows.
placeholder
WTI declines below $61.00 as US stockpile builds, Venezuelan exports resumeWest Texas Intermediate (WTI), the US crude oil benchmark, is trading around $60.70 during the Asian trading hours on Wednesday. The WTI price declines as Venezuela resumes exports and the American Petroleum Institute (API) shows a big build in US crude inventories.
Author  FXStreet
Jan 14, Wed
West Texas Intermediate (WTI), the US crude oil benchmark, is trading around $60.70 during the Asian trading hours on Wednesday. The WTI price declines as Venezuela resumes exports and the American Petroleum Institute (API) shows a big build in US crude inventories.
placeholder
BNB Price Forecast: On the verge of breakout as derivatives traders bet on gainsBNB (BNB), formerly known as Binance Coin, is trading above $910 at the time of writing on Tuesday, nearing the upper consolidation boundary. The two months of sideways price action could end, with improving sentiment in the derivatives market suggesting potential upside.
Author  FXStreet
Jan 13, Tue
BNB (BNB), formerly known as Binance Coin, is trading above $910 at the time of writing on Tuesday, nearing the upper consolidation boundary. The two months of sideways price action could end, with improving sentiment in the derivatives market suggesting potential upside.
goTop
quote