

Bitcoin Weekly Forecast: Early-2026 rally falters as BTC investors await key catalyst
- Bitcoin price holds $90,000 on Friday after being rejected at a key resistance zone.
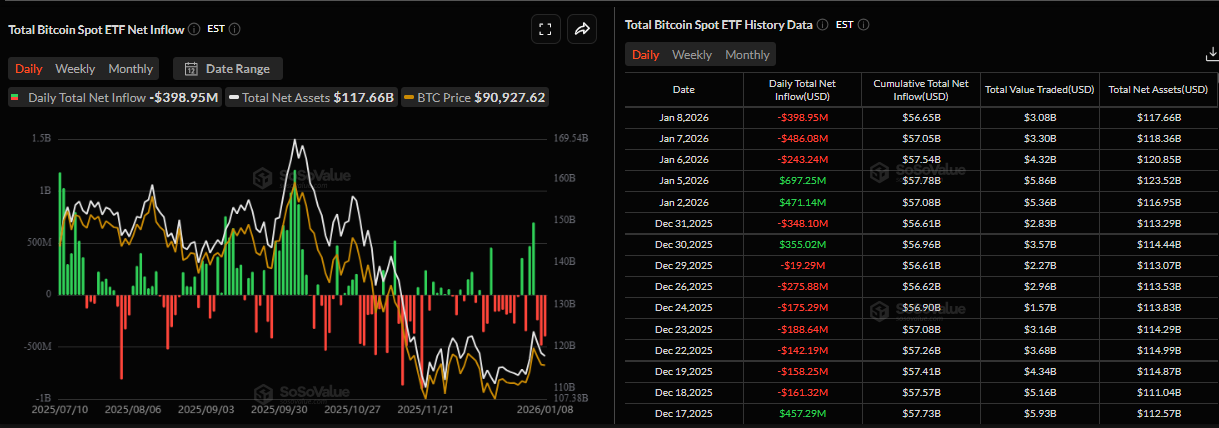
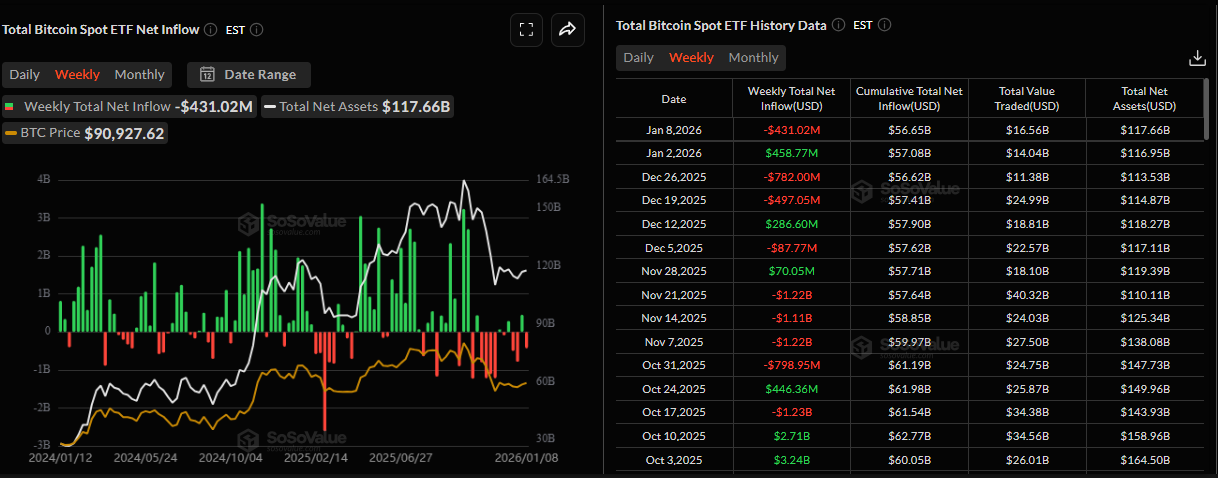
- Institutional demand for Bitcoin weakens, with spot ETFs recording a net $431.02 million weekly outflow by Thursday.
- BTC must absorb heavy sell-side pressure between $92,100 and $117,400 before a sustainable rally can resume, analysts say.
Bitcoin (BTC) is trading lower toward $90,000 on Friday after encountering rejection at a key resistance zone. The price pullback in BTC is supported by fading institutional demand, as spot Exchange Traded Funds (ETFs) have recorded net outflows so far this week. Meanwhile, a report highlights that the BTC market structure is moving toward selective re-risking and rebuilding, and clearing supply overhang levels is needed before a directional move.
Fading institutional demand
Bitcoin started the week on a positive note but corrected midweek, consolidating around the key support level of $90,000 on Friday. The institutional flows supported this price action of the largest cryptocurrency by market capitalization.
According to SoSoValue, US-listed BTC spot ETFs recorded an inflow of $697.25 million on Monday, but three consecutive days of outflows totaling $1.12 billion by Thursday, resulting in net withdrawals of $431.02 so far this week. This negative flow suggests a decline in institutional investor demand. If these outflows continue and intensify, the BTC price could see further correction.
Despite the weakening institutional demand, the corporate demand for BTC remains strong. Strategy Executive Chairman Michael Saylor announced on Monday that his company, Strategy Inc., purchased 1,287 Bitcoin, bringing the total reserve to 673,783 BTC, highlighting the firm’s continued aggressive accumulation strategy and long-term conviction in Bitcoin. In addition, the firm has increased its USD reserve by $62 million to $2.25 billion, indicating a stronger liquidity position and greater flexibility for future Bitcoin acquisitions.
On Wednesday, Morgan Stanley announced that it had filed S-1 registration statements with the US Securities and Exchange Commission (SEC) for spot Bitcoin and Solana ETFs, underscoring growing interest among Wall Street investors.
If approved, this would suggest a bullish outlook for BTC and SOL in the long term, as these ETFs could positively affect their prices by allowing investors to gain exposure without directly holding cryptocurrencies, while also enhancing liquidity, legitimacy, and overall adoption.
Bitcoin traders remain calm amid the Venezuela crisis
On Saturday, the US carried out a large-scale military strike against Venezuela, capturing the Venezuelan leader, President Nicolás Maduro, and his wife, Cilia Flores. This development has brought geopolitical risk back into focus. While such headlines often trigger concern across global markets, BTC traders remain calm about this news.
CryptoQuant Exchange Netflow, which tracks whether Bitcoin is moving into or out of exchanges, suggests a calm trading environment. The chart below shows that Netflow at the exchange did not change significantly in response to Saturday's news.
 - All Exchanges (10)-1767951042084-1767951042085.png)
Historical conflicts — including Russia’s invasion of Ukraine and escalations in the Middle East — have often led to short-term volatility in Bitcoin prices. However, Exchange Netflow has rarely worsened in a sustained way. Since 2023, the market has become more resilient to localized military conflicts, with initial reactions fading quickly.
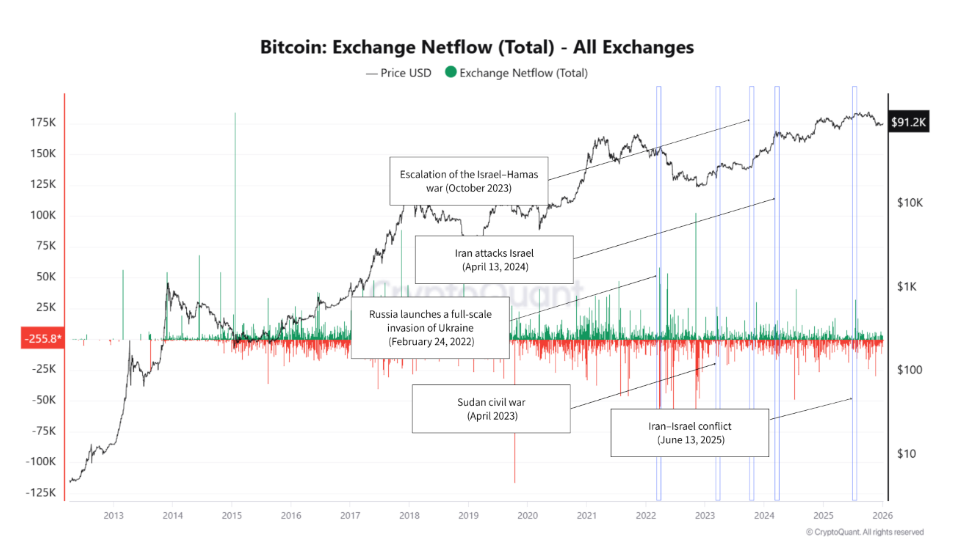
In the case of the current Venezuela conflict, a similar pattern emerges. Despite some price sensitivity, there are no signs of large-scale Bitcoin inflows into exchanges. Panic selling is absent, suggesting that the market is cautious rather than fearful.
All eyes on Venezuela’s “shadow” BTC reserve
QCP’s Capital reported on Monday that Washington’s shock over Venezuela could serve as a near-term catalyst for BTC. The analyst explained that, beyond the disinflationary impulse from lower Oil prices, market chatter has revived claims that Venezuela may control a substantial “shadow” BTC reserve, potentially comparable in scale to Strategy’s holdings. These claims are unverified.
“If accurate, this would put Venezuela as the largest sovereign holder of BTC. Such an outcome would be consistent with the country’s growing reliance on crypto across various businesses, including the use of USDT in oil transactions since 2024. Moreover, the prospect of the US adding any seized BTC to its own strategic reserve reduces the likelihood of forced selling and underscores BTC’s rising strategic importance as nations compete to accumulate,” read the report.
BTC’s behavior shifts from distribution to selective re-risking
Glassnode's weekly report on Wednesday highlighted that the market is transitioning away from defensive, distribution-driven behaviour toward selective re-risking and rebuilding participation.
The report explained that BTC begins the year by clearing a significant portion of legacy positioning across spot, futures, and options markets.
“The late-2025 deleveraging event and year-end expiry cycle have effectively reset the market’s structural constraints, leaving a cleaner, more transparent signal environment,” noted the analyst.
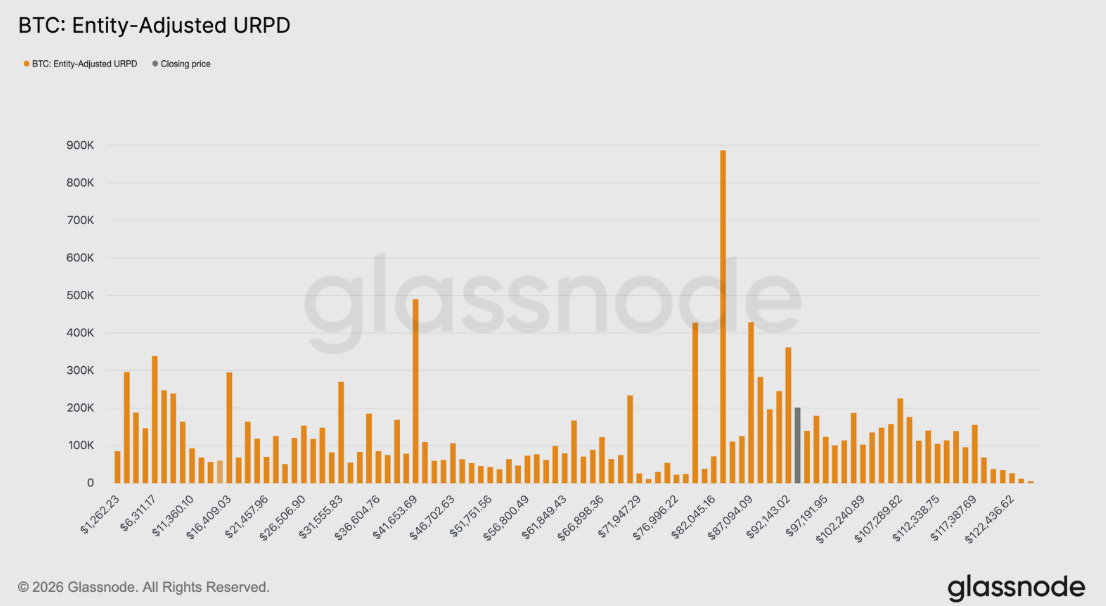
The analyst concluded that while structural accumulation remains measured, clearing positioning overhangs between $92,100 and $117,400, as shown in the chart below. These cohort wallets have bought BTC near the cycle highs and held through the drawdown from the all-time high to $80,000. As a result, BTC is facing rising breakeven sell-side pressure as these investors regain the opportunity to exit positions without realizing losses, making these levels key areas of resistance. Consequently, any attempt to revive a sustained bull phase will likely require time and resilience to absorb this supply overhang, allowing the price to move beyond the recent buyers’ distribution zone.
Macroeconomic development could act as a catalyst
The US Bureau of Labor Statistics (BLS) will release the Nonfarm Payrolls (NFP) data for December on Friday at 13:30 GMT.
The US Dollar (USD) is likely to experience heightened volatility, as the employment report could provide key clues about how the Federal Reserve (Fed) will approach policy-making this year. This volatility is evident in risky assets such as Bitcoin and could drive a directional move in the largest cryptocurrency by market capitalization.
In an exclusive interview, Fabian Dori, Chief Investment Officer at Sygnum Bank, told FXStreet that markets are beginning the first full business week of the year with numerous key macroeconomic data points scheduled for release. Of particular interest are the NFP, unemployment, and wage growth figures, as the Fed justified the latest interest rate cuts on a softening labor market.
Dori continued that while PMI sub-indices for new orders and service employment have recently improved, a material re-acceleration in hiring or wage growth would come as a surprise. Combined with recent softer-than-expected inflation data, solidly anchored inflation expectations, and ongoing debate about the level of the neutral rate under evolving Fed leadership, risks to the rate policy outlook may be skewed toward more easing than currently priced in. This would be particularly beneficial for higher-beta risk assets, including technology, mid- and small-cap stocks, and blue-chip crypto assets.
Will BTC hold the key support zone?
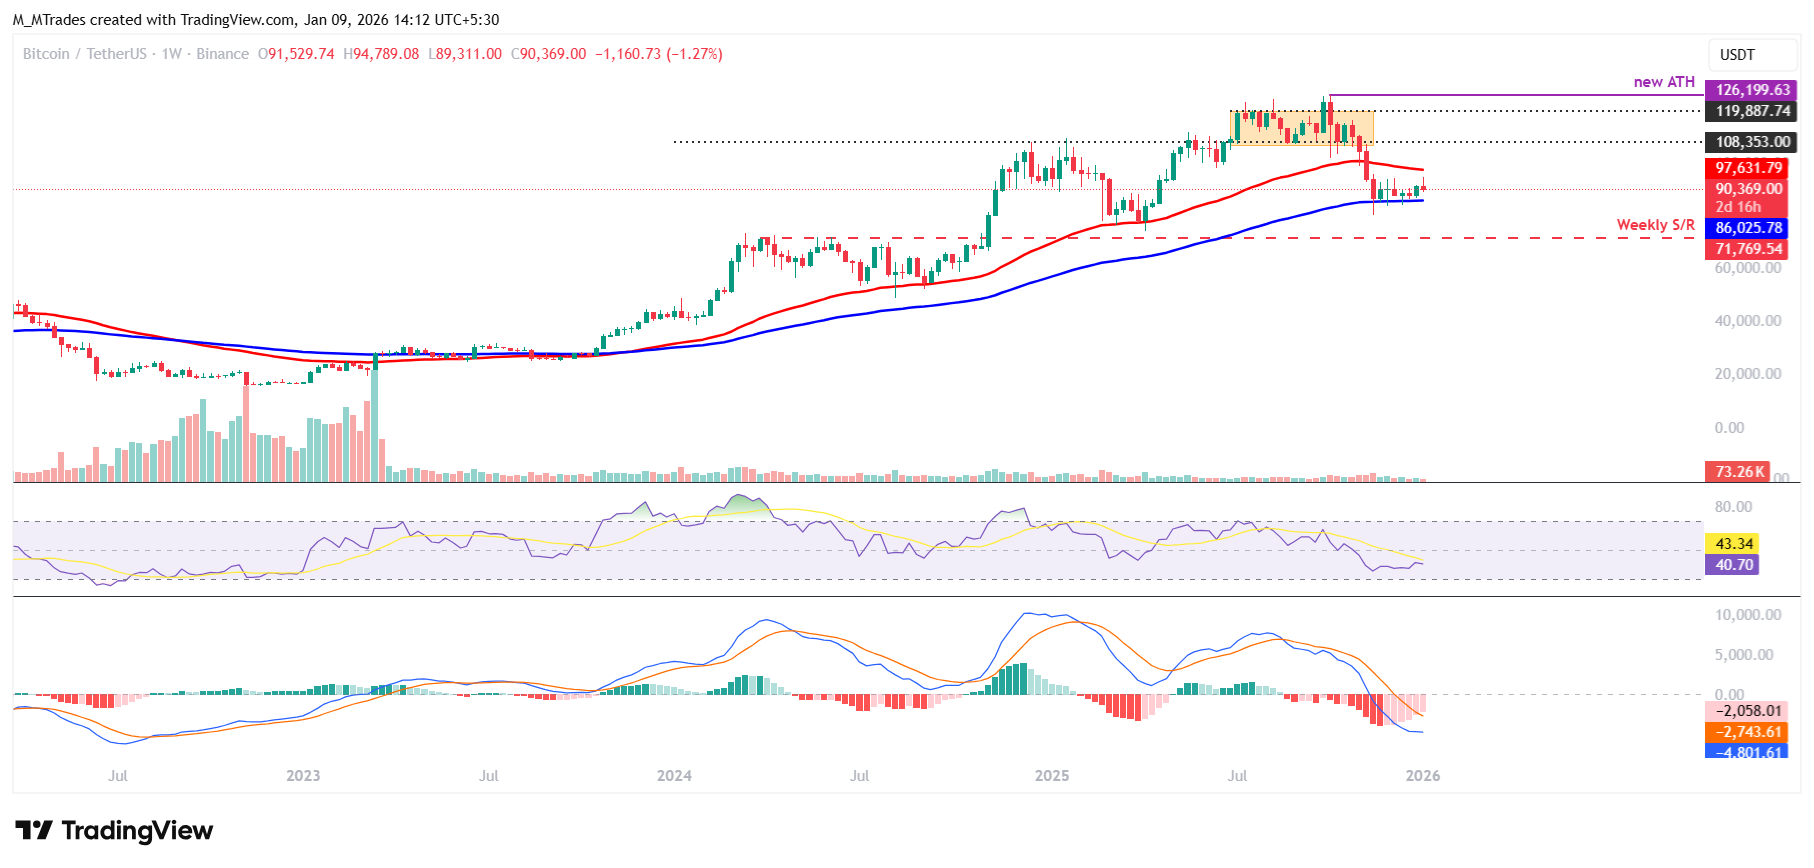
Bitcoin’s weekly chart shows the price finding support around the 100-week Exponential Moving Average (EMA) at $86,025, consolidating above this zone since the end of November. As of this week, BTC is trading at around $90,300.
If the 100-week EMA at $86,025 continues to hold, BTC could extend the rally toward the immediate resistance at $97,631, the 50-week EMA.
The Relative Strength Index (RSI) on the weekly chart is 40, still below the neutral level of 50, indicating that bears remain in control. However, the RSI is flattening around this level, signaling that selling pressure may be stabilizing and downside momentum is beginning to weaken.
On the daily chart, BTC price was rejected at the 61.8% Fibonacci retracement level (from the April low of $74,508 to October's all-time high of $126,199) at $94,253 on Tuesday. It declined nearly 3% over the next two days, retesting a previously broken upper consolidation zone at $90,000. As of Friday, BTC trades near the $90,000 support level.
If BTC continues its pullback and closes below $90,000 on a daily basis, it could extend the decline toward the next support level at $85,569 (78.6% Fibonacci retracement).
The Relative Strength Index (RSI) on the daily chart is pointing downward toward the neutral level of 50, signaling a fading bullish momentum. If the RSI slips and remains below the neutral level, BTC could correct sharply.
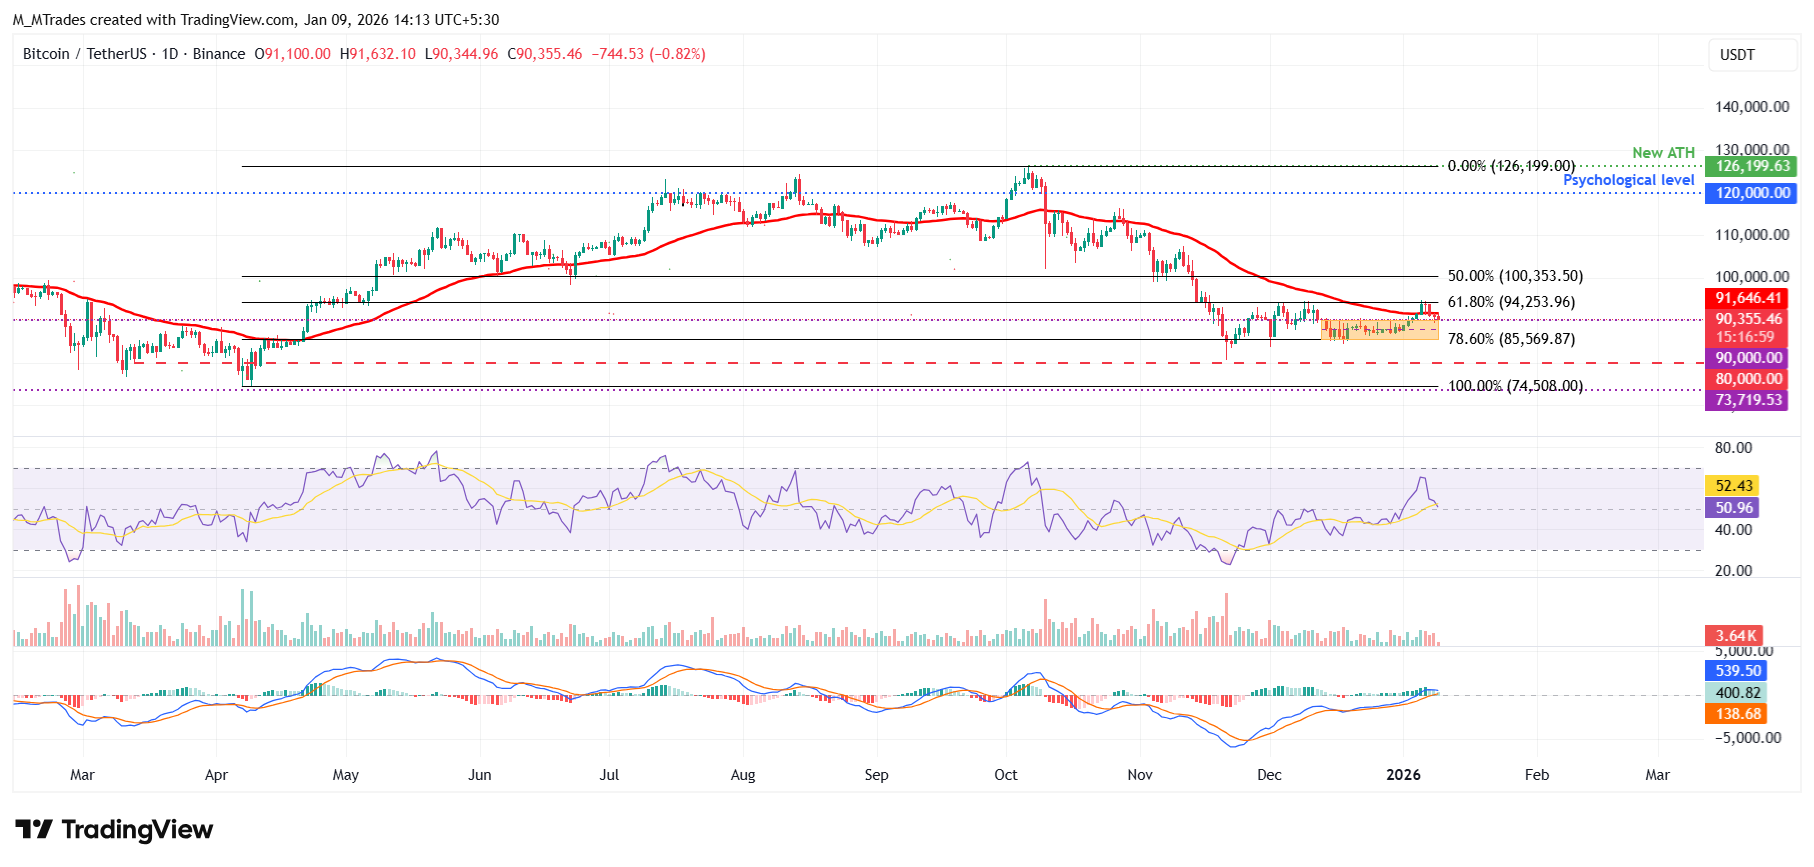
If the $90,000 support holds, BTC could extend the recovery toward the key resistance level at $94,253.
Bitcoin, altcoins, stablecoins FAQs
Bitcoin is the largest cryptocurrency by market capitalization, a virtual currency designed to serve as money. This form of payment cannot be controlled by any one person, group, or entity, which eliminates the need for third-party participation during financial transactions.
Altcoins are any cryptocurrency apart from Bitcoin, but some also regard Ethereum as a non-altcoin because it is from these two cryptocurrencies that forking happens. If this is true, then Litecoin is the first altcoin, forked from the Bitcoin protocol and, therefore, an “improved” version of it.
Stablecoins are cryptocurrencies designed to have a stable price, with their value backed by a reserve of the asset it represents. To achieve this, the value of any one stablecoin is pegged to a commodity or financial instrument, such as the US Dollar (USD), with its supply regulated by an algorithm or demand. The main goal of stablecoins is to provide an on/off-ramp for investors willing to trade and invest in cryptocurrencies. Stablecoins also allow investors to store value since cryptocurrencies, in general, are subject to volatility.
Bitcoin dominance is the ratio of Bitcoin's market capitalization to the total market capitalization of all cryptocurrencies combined. It provides a clear picture of Bitcoin’s interest among investors. A high BTC dominance typically happens before and during a bull run, in which investors resort to investing in relatively stable and high market capitalization cryptocurrency like Bitcoin. A drop in BTC dominance usually means that investors are moving their capital and/or profits to altcoins in a quest for higher returns, which usually triggers an explosion of altcoin rallies.
Nothing in this material constitutes investment advice, personal recommendation, investment research, an offer, or a solicitation to buy or sell any financial instrument. The content has been prepared without consideration of your individual investment objectives, financial situation, or needs, and should not be treated as such.
Past performance is not a reliable indicator of future performance and/or results. Forward-looking scenarios or forecasts are not a guarantee of future performance. Actual results may differ materially from those anticipated.
Mitrade makes no representation or warranty as to the accuracy or completeness of the information provided and accepts no liability for any loss arising from reliance on such information.
Recommended Articles


