

General Electric Co Stock (GE) Moved Down by 3.35% on Mar 5: Facts Behind the Movement
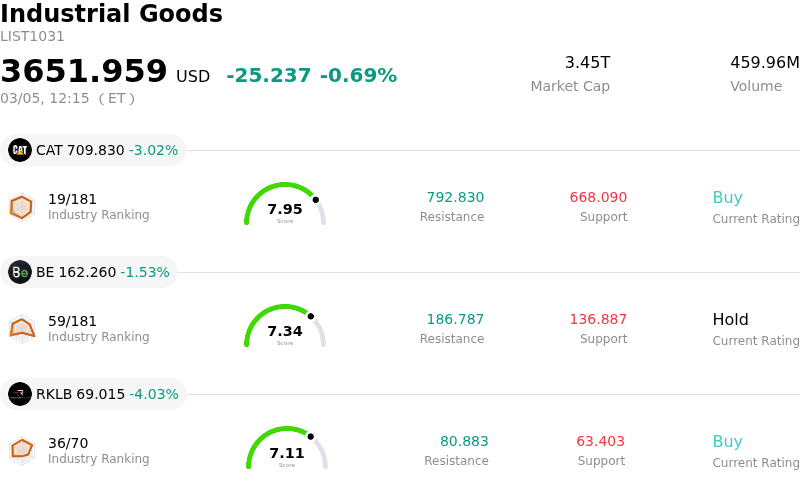
General Electric Co (GE) moved down by 3.35%. The Industrial Goods sector is down by 0.69%. The company underperformed the industry. Top 3 stocks by trading volume in the sector: Caterpillar Inc (CAT) down 3.02%; Bloom Energy Corp (BE) down 1.53%; Rocket Lab USA Inc (RKLB) down 4.03%.
What is driving General Electric Co (GE)’s stock price down today?
The downward movement in the company's shares today, amidst significant intraday volatility, appears to be influenced by a combination of broader market concerns and specific company-related risks. A general negative sentiment across the industrial goods sector, possibly stemming from macroeconomic factors such as geopolitical tensions impacting crude oil prices and concerns over persistent inflation delaying anticipated interest rate cuts, likely contributed to this pressure.
Company-specific factors also played a role. There are reports of a potential durability issue with a seal on the engine used in Boeing's 777X aircraft, which could lead to redesign and retrofitting requirements, posing operational and financial risks. Analysts have also highlighted concerns about the company's valuation at current levels, suggesting a potential for market correction or profit-taking after a period of considerable gains. Furthermore, a pattern of insider stock sales over the past several months could indicate a cautious outlook from internal stakeholders. Projections also suggest anticipated declines in industry service volumes in the long term for the aerospace segment, which could present challenges to maintaining profitability from engine servicing.
Despite these pressures, the underlying fundamentals of the company remain robust, with strong fourth-quarter earnings exceeding expectations and optimistic guidance for the current year. Many Wall Street analysts maintain positive ratings and have recently increased price targets, reflecting a generally bullish long-term perspective. The significant volatility seen today likely reflects investors weighing these strong fundamentals and analyst optimism against the immediate risks and broader market sentiment, leading to a dynamic trading environment.
Technical Analysis of General Electric Co (GE)
Technically, General Electric Co (GE) shows a MACD (12,26,9) value of [7.61], indicating a buy signal. The RSI at 59.48 suggests neutral condition and the Williams %R at -23.55 suggests oversold condition. Please monitor closely.
Fundamental Analysis of General Electric Co (GE)
General Electric Co (GE) is in the Industrial Goods industry. Its latest annual revenue is $45.85B, ranking 5 in the industry. The net profit is $8.70B, ranking 1 in the industry. Company Profile
Over the past month, multiple analysts have rated the company as Buy, with an average price target of $357.03, a high of $405.00, and a low of $290.00.
More details about General Electric Co (GE)
Company Specific Risks:
- GE Aerospace faces persistent supply chain constraints, which led to a decline in operating margin to 18.9% in Q3 2025, down from 20.3% year-over-year.
- The company exhibits a primary liquidity risk due to a low Quick Ratio of 0.76.
- Analysts express concerns regarding a downward revision of 2025 revenue estimates by approximately $100 million, attributed to lower LEAP engine deliveries and economic recovery uncertainties.
- Valuation models suggest GE stock may be overvalued, with some analyses indicating the current price sits above estimated future cash flow values.
Nothing in this material constitutes investment advice, personal recommendation, investment research, an offer, or a solicitation to buy or sell any financial instrument. The content has been prepared without consideration of your individual investment objectives, financial situation, or needs, and should not be treated as such.
Past performance is not a reliable indicator of future performance and/or results. Forward-looking scenarios or forecasts are not a guarantee of future performance. Actual results may differ materially from those anticipated.
Mitrade makes no representation or warranty as to the accuracy or completeness of the information provided and accepts no liability for any loss arising from reliance on such information.
Recommended Articles


