

Solana Price Forecast: Rising demand in SOL ETFs and derivatives boosts bullish rebound


Solana extends the 9% recovery from Tuesday, aiming for the 50-day EMA at $157.
Derivatives data suggest a positive shift in investors' risk appetite as Open Interest increases.
Solana ETFs record a surge in inflows amid Vanguard’s approval of crypto ETFs.
Solana (SOL) trades above $140 by press time on Wednesday, up over 10% in the last 24 hours as Vanguard offers crypto Exchange Traded Funds (ETFs), including Solana ETFs. The sudden recovery boosts risk-on sentiment in Solana derivatives as investors anticipate further gains. Technically, the outlook for Solana centers on a potential double-bottom breakout targeting the 50-day Exponential Moving Average (EMA).
Demand is back for Solana on all levels
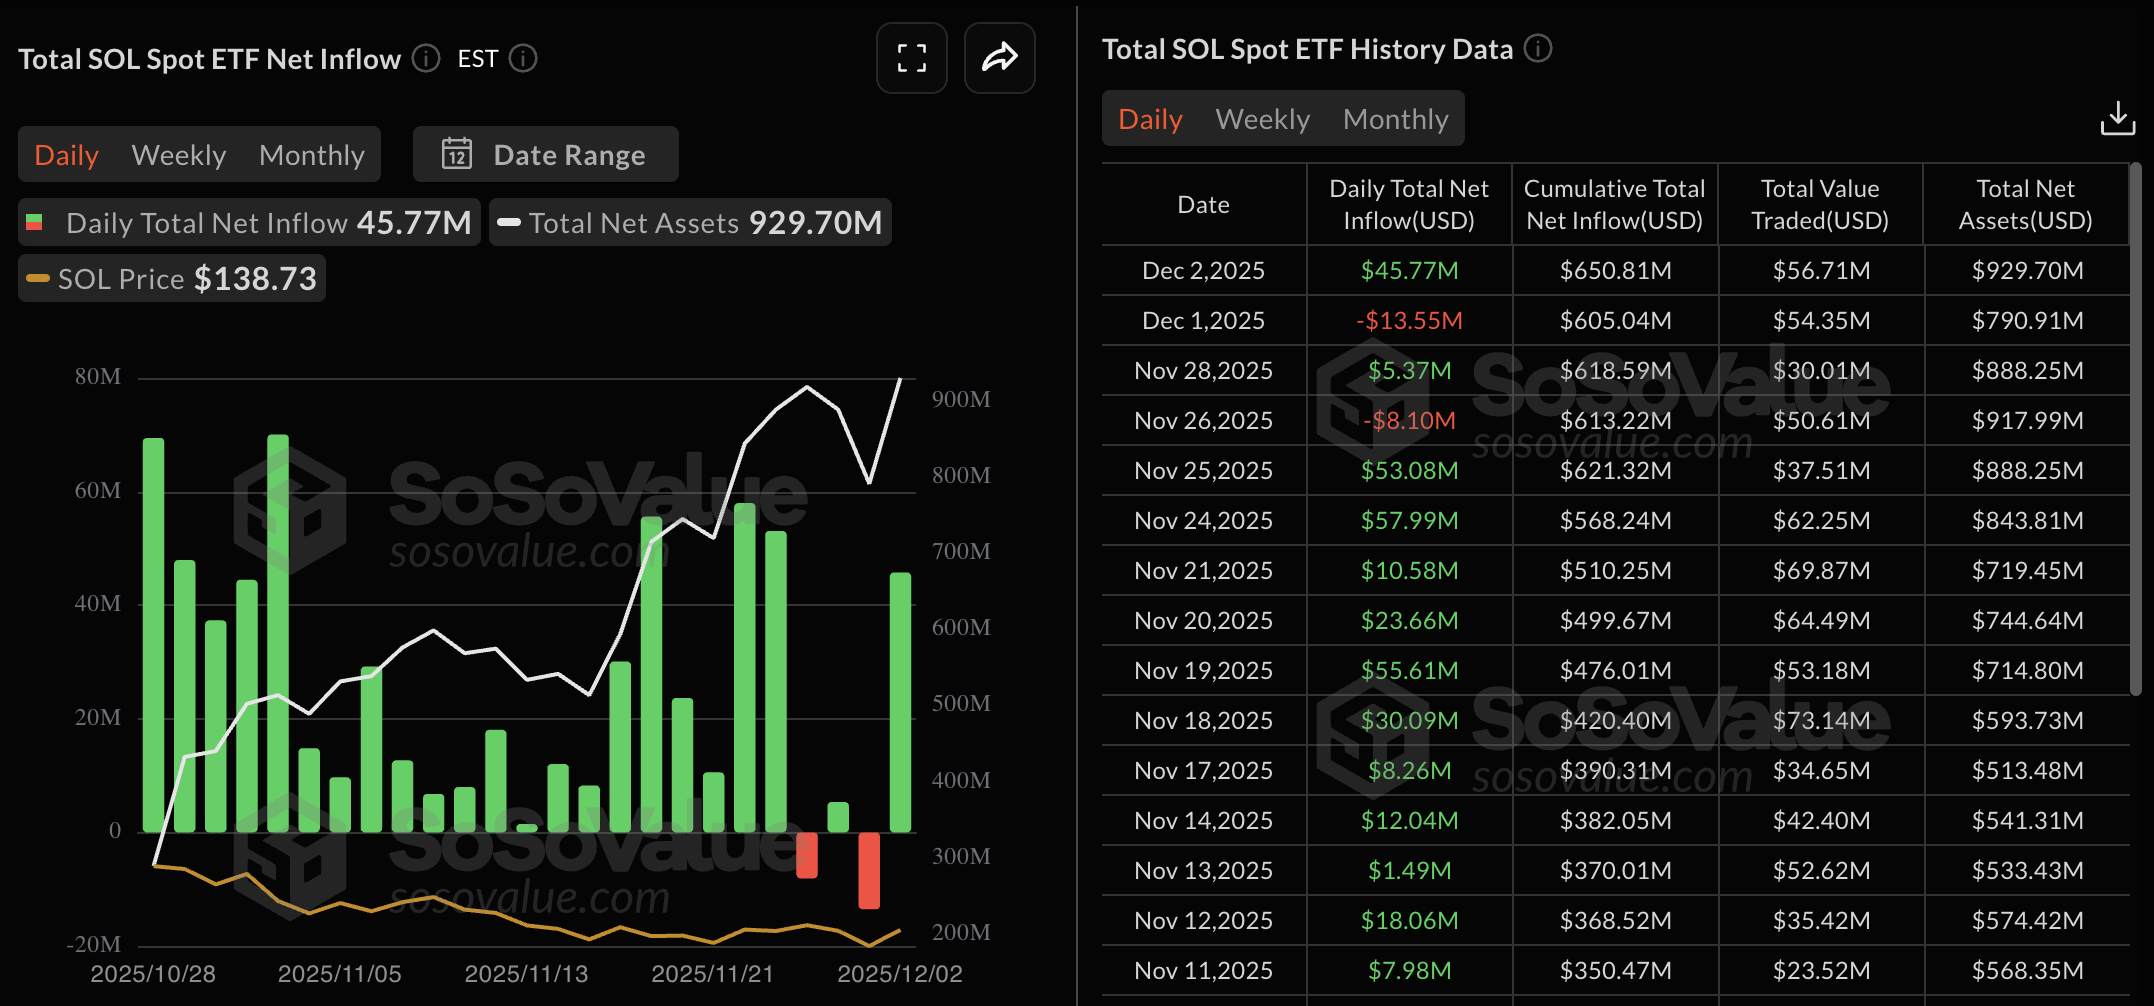
Vanguard's crypto-focused ETFs, including Bitcoin (BTC), Ethereum (ETH), Solana (SOL), and Ripple (XRP), are heating up the cryptocurrency market. Solana is experiencing a renewal in institutional demand with a net inflow of $45.77 million on Tuesday, flipping up from a net outflow of $13.55 million on Monday. Typically, an increase in ETF inflows signals better odds of further recovery and boosts investor confidence.
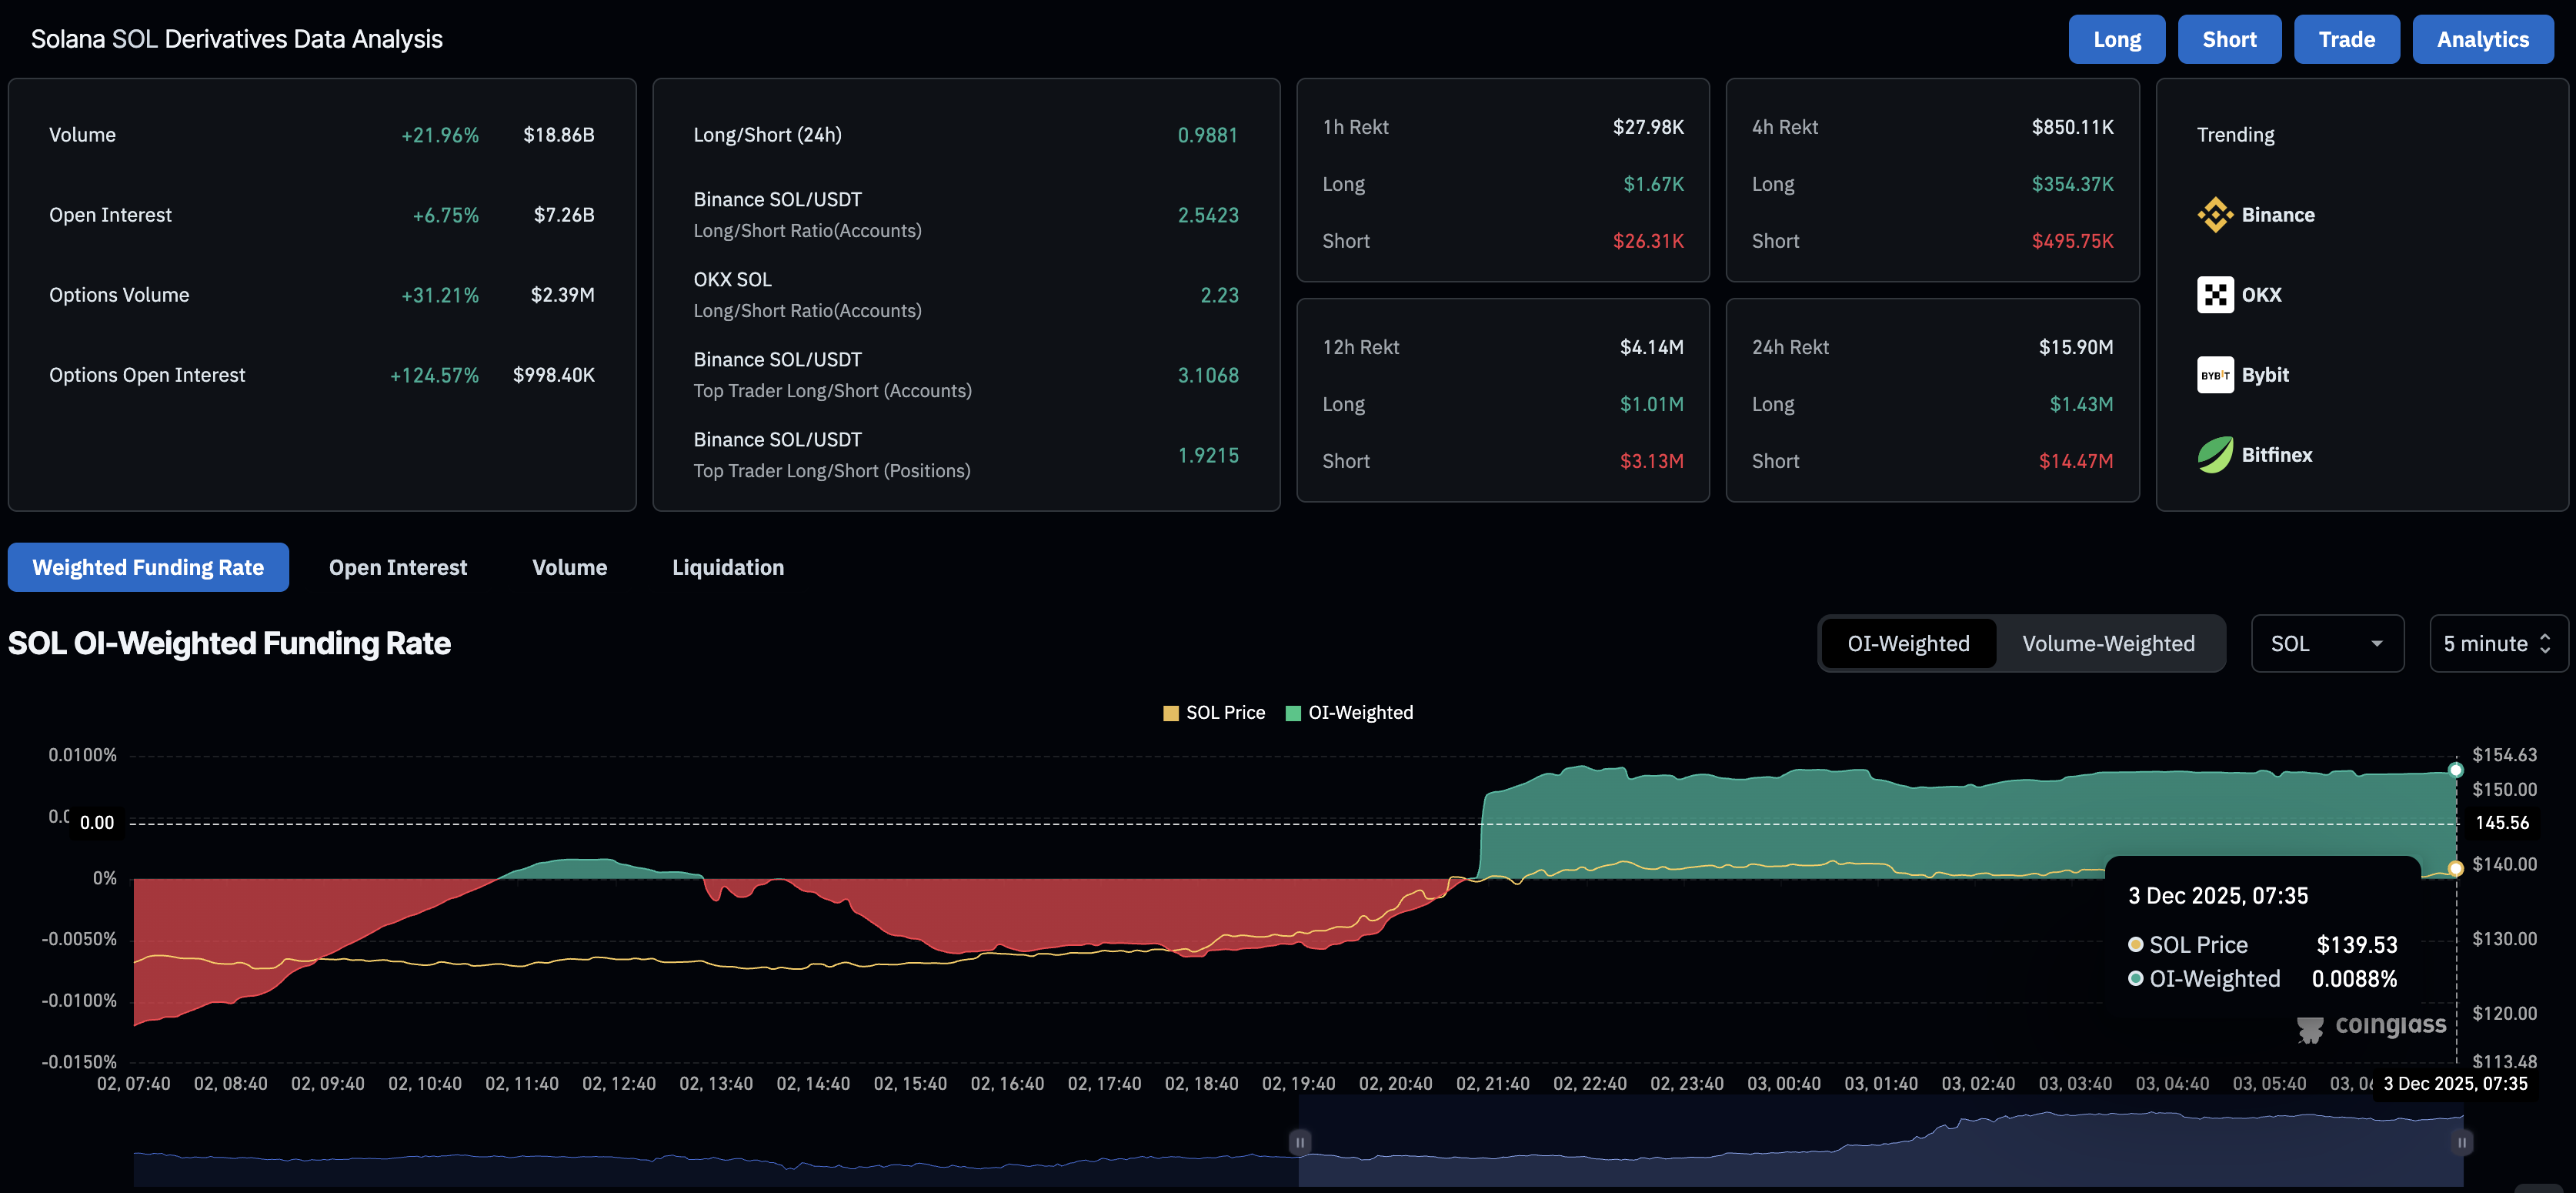
In line with institutional demand, Solana derivatives experience a rise in risk exposure as investors bet on further recovery. CoinGlass data shows that Solana futures Open Interest (OI) stands at $7.26 billion, up 6.75% over the last 24 hours, reflecting an increase in capital at risk.
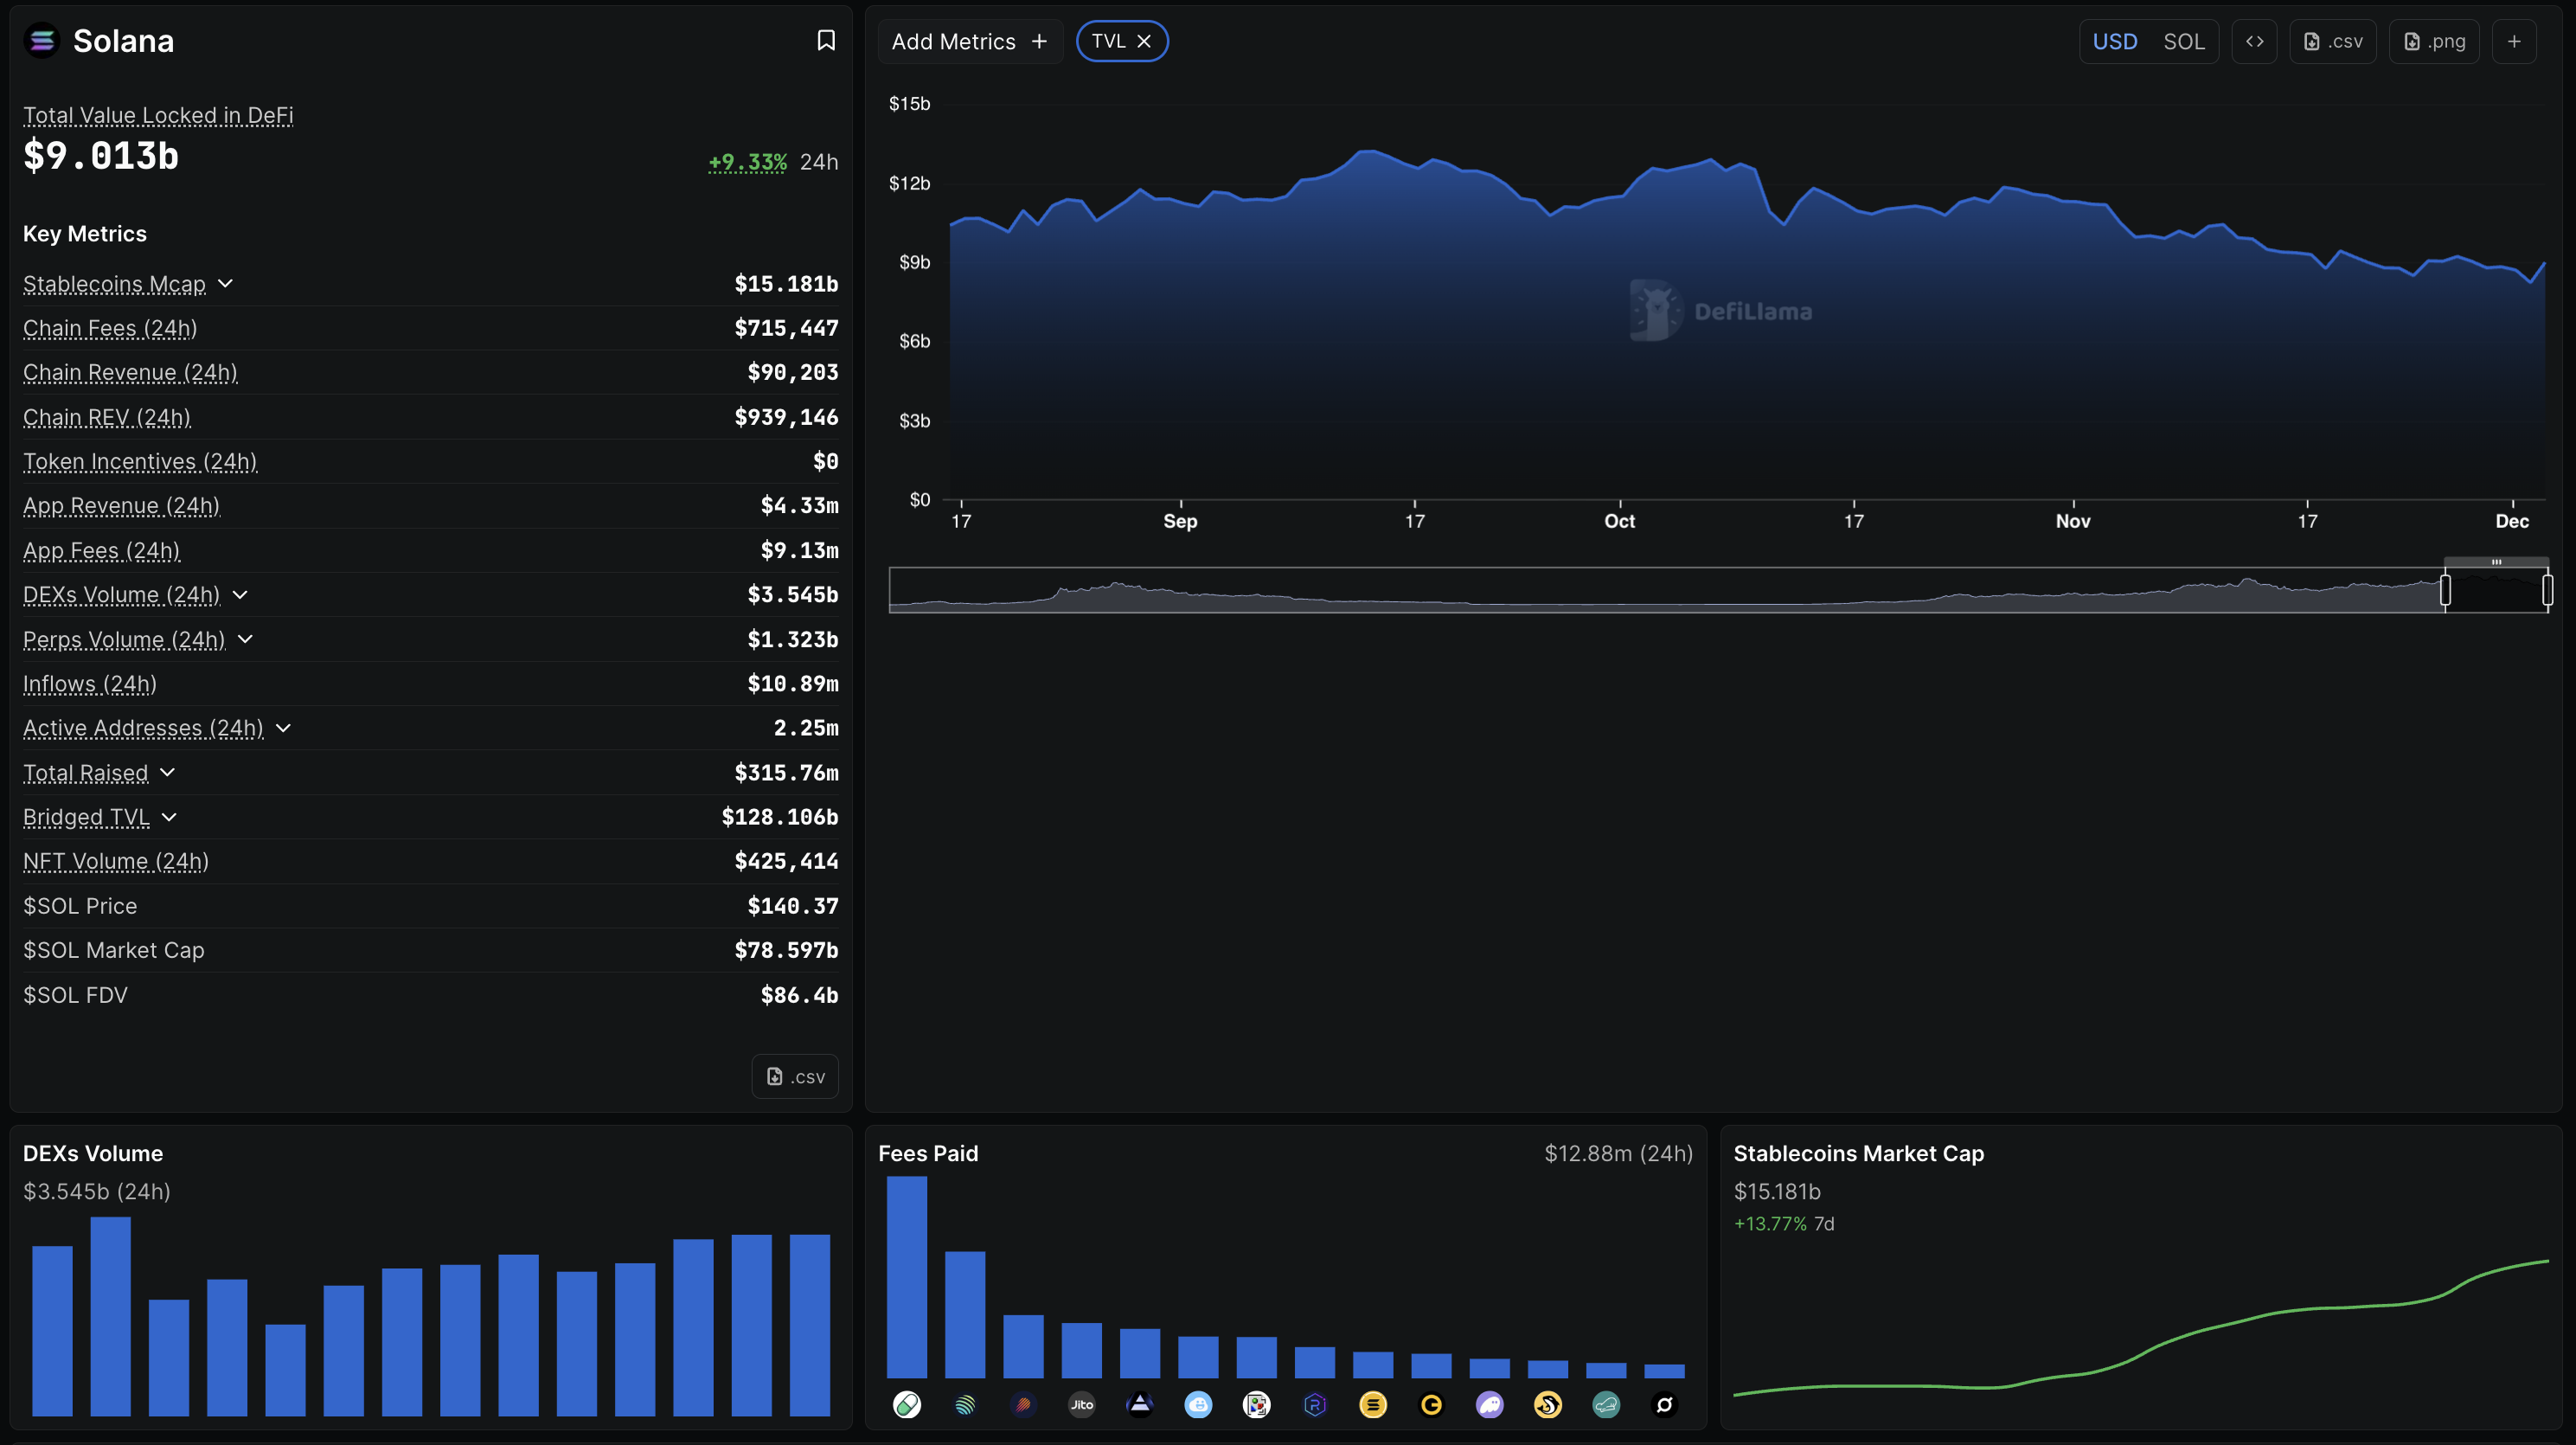
On a more positive note, on-chain data shows an increase in Solana adoption, with its Total Value Locked (TVL) rising 9.33% in the last 24 hours to $9.013 billion. A surge in TVL reflects increased user deposits on the blockchain, signaling greater activity and adoption.
Additionally, the stablecoin liquidity on Solana has increased by over 13% in the last week to $15.181 billion.
Technical outlook: Is Solana ready for a breakthrough?
Solana bounced off the $126 support, which has remained intact since the June 22 low and avoided a daily close beneath it. The rebound also forms a double-bottom pattern with a neckline near $145, close to the November 20 high.
If SOL confirms a daily close above $145, it could extend the rally to the 50-day EMA at $158, followed by the 200-day EMA at $175.
The Relative Strength Index (RSI) at 48 on the daily chart shows a steady rise from oversold levels, indicating a sharp decline in bearish pressure. At the same time, the Moving Average Convergence Divergence (MACD) shows steady recovery within the negative territory.
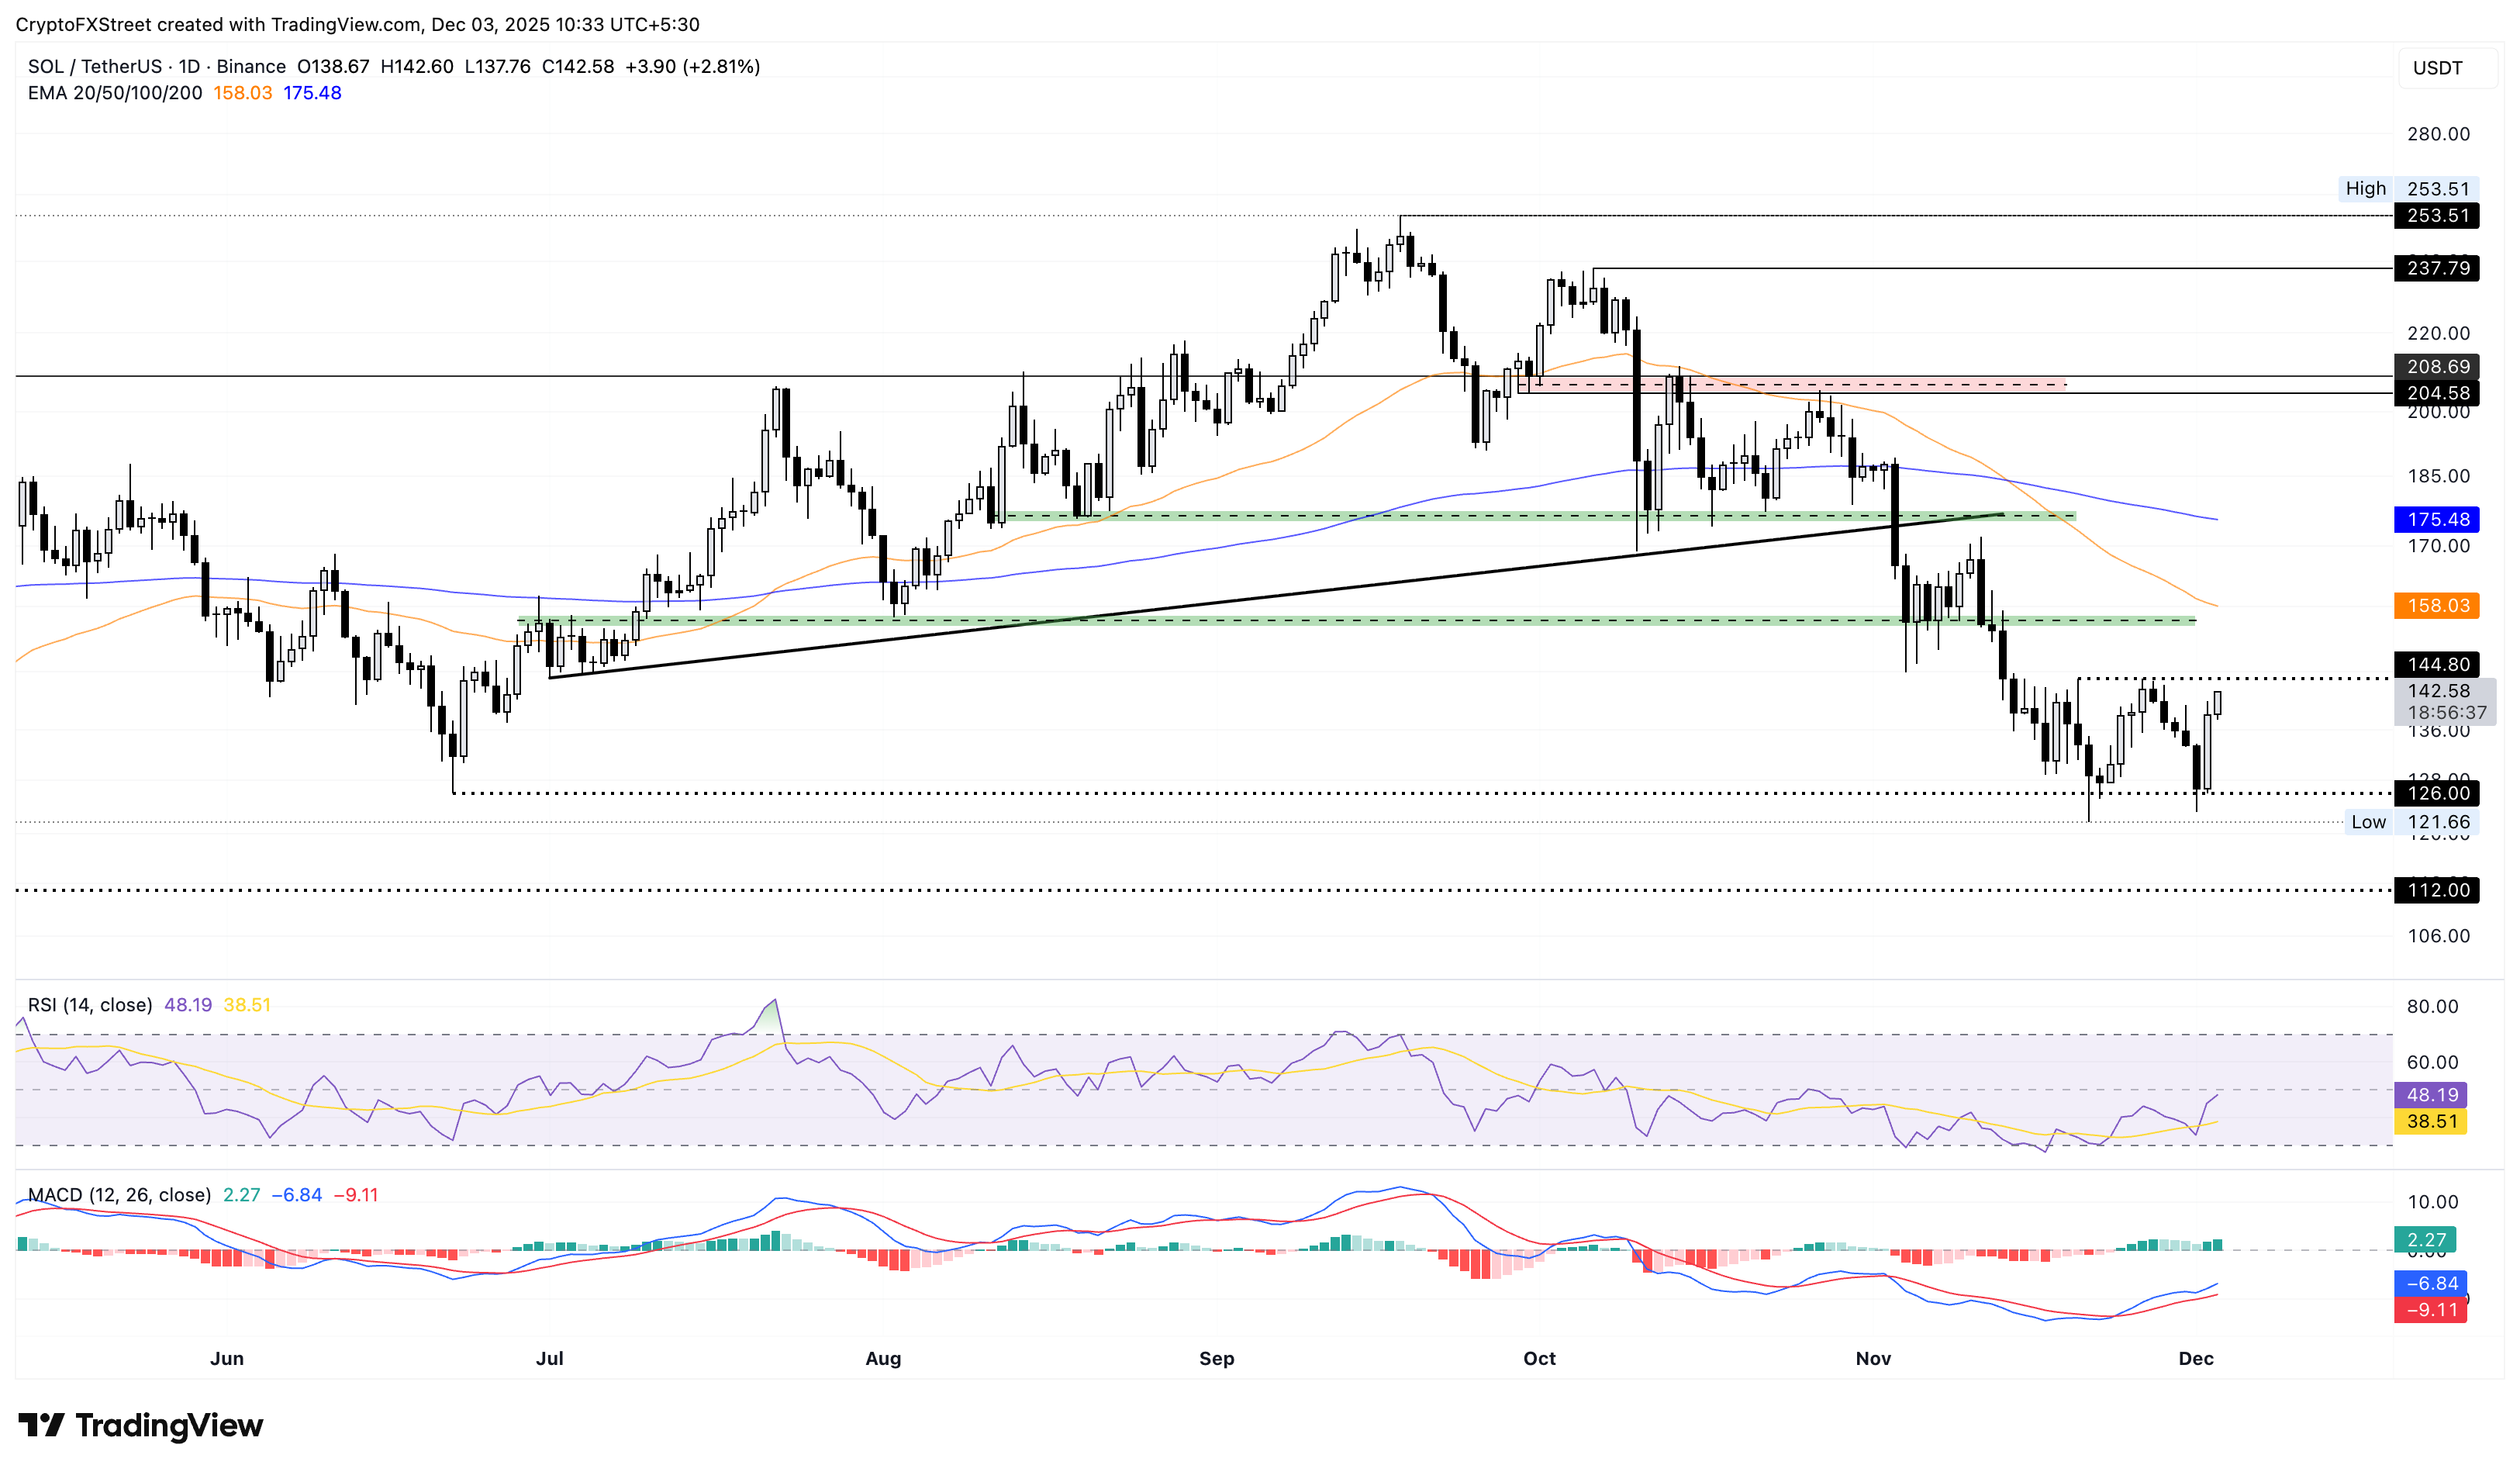
On the flip side, a reversal from $145 could shift Solana into a consolidation phase with the lower band at $126.
The above content was completed with the assistance of AI and has been reviewed by an editor.
Disclaimer: The content available on Mitrade Insights is provided for informational and marketing purposes only. It has not been prepared in accordance with legal requirements designed to promote the independence of investment research and is not subject to any prohibition on dealing ahead of the dissemination of investment research.
Nothing in this material constitutes investment advice, personal recommendation, investment research, an offer, or a solicitation to buy or sell any financial instrument. The content has been prepared without consideration of your individual investment objectives, financial situation, or needs, and should not be treated as such.
Past performance is not a reliable indicator of future performance and/or results. Forward-looking scenarios or forecasts are not a guarantee of future performance. Actual results may differ materially from those anticipated.
Mitrade makes no representation or warranty as to the accuracy or completeness of the information provided and accepts no liability for any loss arising from reliance on such information.


