

Pi Network Price Forecast: Whale Accumulation and Technical Confluence Put PI on Breakout Watch


Pi Network is challenging a critical confluence zone near $0.247, where a decisive breakout could trigger extended upside.
Spot and derivatives data reveal an uptick in significant whale orders, signaling a shift in risk appetite and quiet accumulation.
Momentum remains constructive with RSI above 50 and a sustained MACD crossover, provided the $0.221 weekly support remains intact.
Pi Network (PI) is kicking off the week with renewed vigor. Having recovered from a nearly 5% dip on Friday, the token has erased those losses and is currently pressing against a dense resistance cluster around $0.247 (as of Monday writing). This reversal coincides with detectable whale activity and strengthening momentum signals, placing PI firmly on the breakout radar—assuming buyers maintain bid pressure.
Whale flows signal bullish intent
Underlying metrics from CryptoQuant suggest that larger market participants are asserting dominance. Both spot and futures markets are registering an uptick in sizable whale orders—a pattern typically indicative of strategic position building rather than short-term retail scalping.
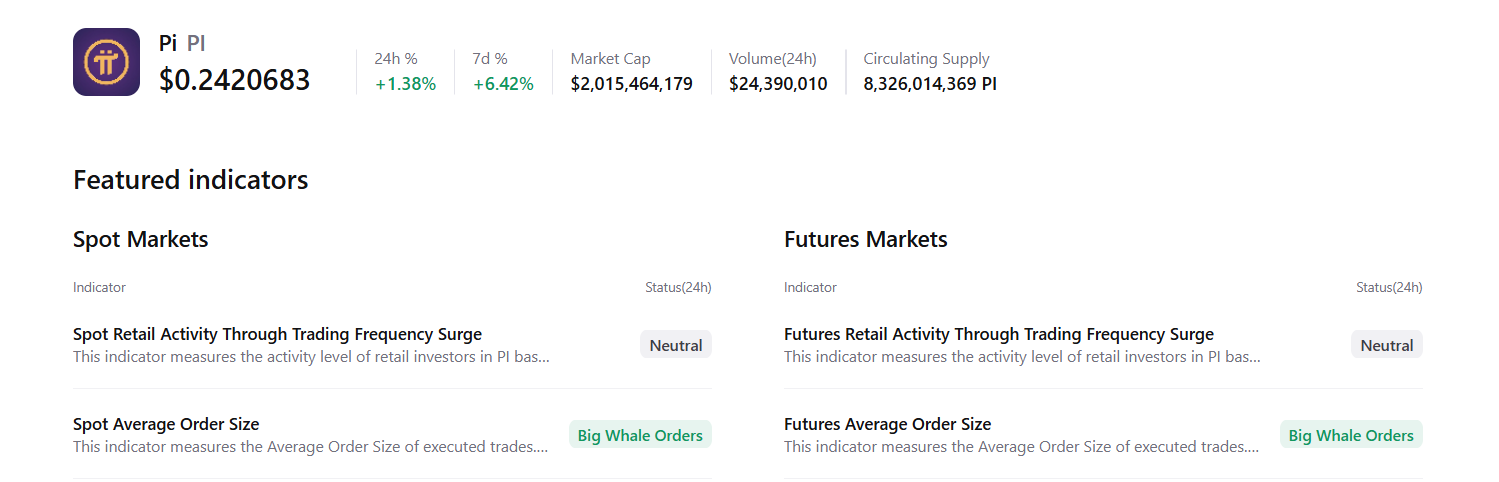
For a volatile asset like Pi Network, this institutional footprint is pivotal. While retail sentiment can be fickle, the re-engagement of "smart money" often arrests downward drifts. The current dynamic—heavy block buying absorbing liquidity despite a relatively quiet broader market—suggests deep-pocketed players are adding exposure into strength. This accumulation creates a fertile environment for a breakout, potentially catching off-guard traders who had dismissed the token as range-bound.
The order flow message is distinct: capital is flowing in, not just on panic dips, but in anticipation of a move. If this behavior persists just below the current resistance band, the probability of a sustained rally increases significantly.
Technical setup: PI tests critical resistance confluence
From a technical perspective, PI has staged an impressive recovery. After retesting the weekly support zone near $0.221 on Friday, price action quickly reversed, pushing back toward the 50-day Exponential Moving Average (EMA) at $0.242 by Monday.
Crucially, this 50-day EMA acts as the lower boundary of a formidable resistance "ceiling." It aligns almost perfectly with the 38.2% Fibonacci retracement level at $0.247 (measured from the August 30 high of $0.398 to the October 10 low of $0.153) and overlaps with a descending trendline active since late summer. This three-factor confluence represents the definitive decision zone for the near term.
A daily close above this trendline and the $0.247 mark would likely shift focus toward the 50% retracement area around $0.276—a logical take-profit level for recent entrants.
Momentum indicators currently favor the bulls. The daily Relative Strength Index (RSI) hovers near 56, firmly in bullish territory, indicating that buying pressure is outpacing selling volume. Furthermore, the Moving Average Convergence Divergence (MACD) maintains the bullish crossover printed last week, reinforcing the thesis that the underlying trend is attempting to turn.
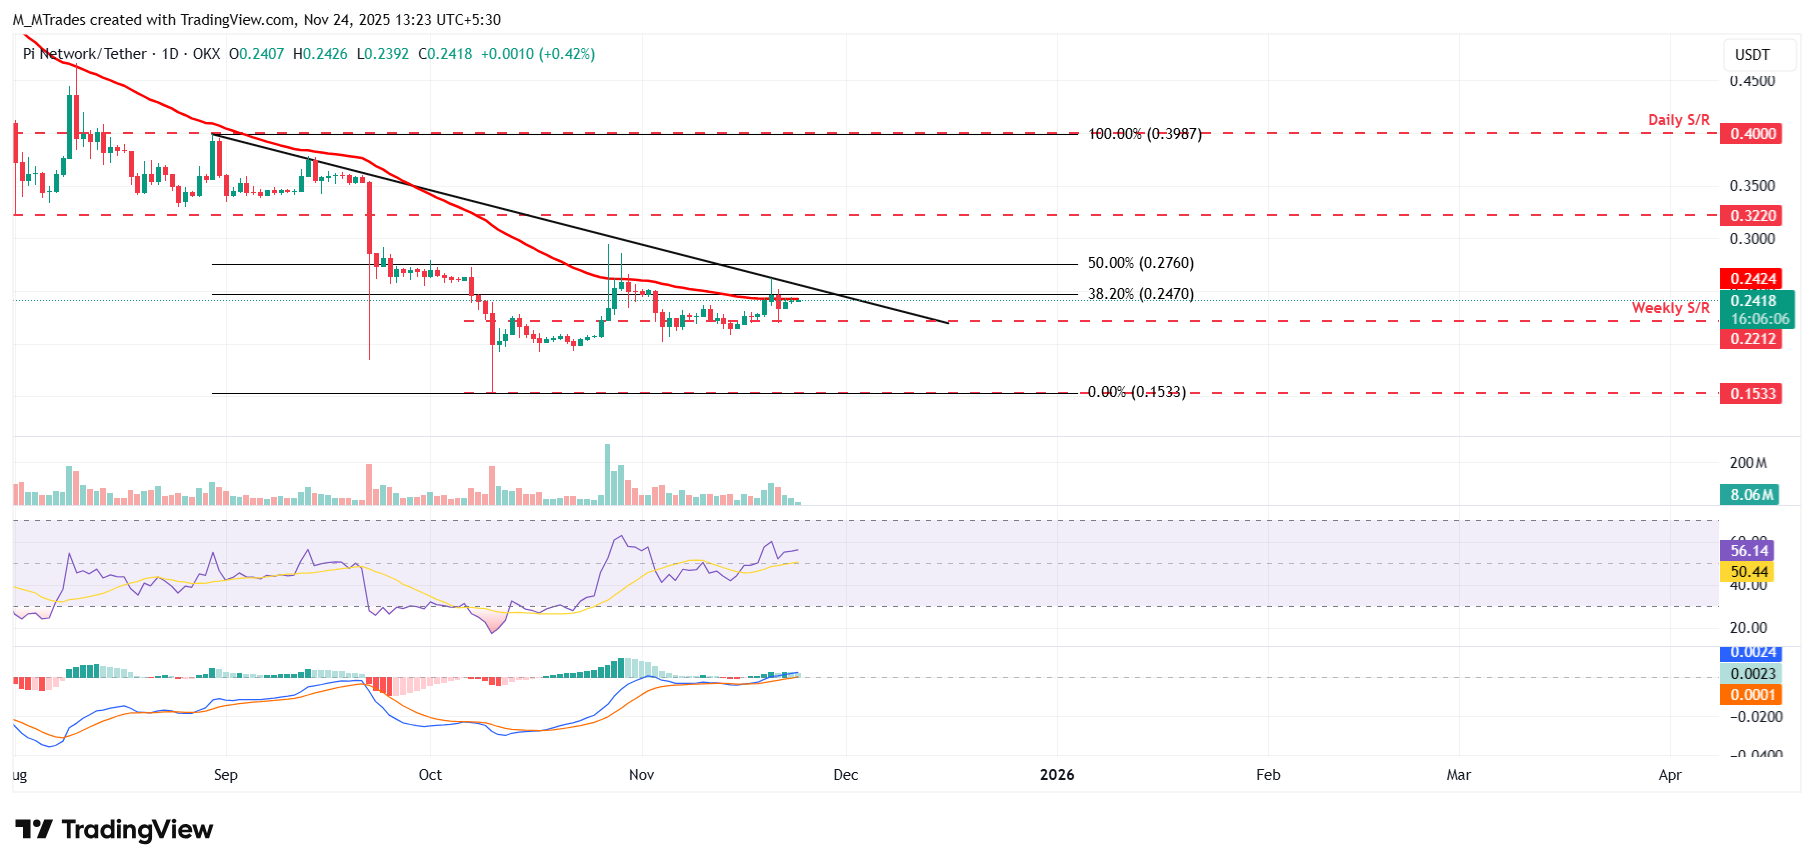
PI/USDT daily chart
However, risks remain clearly defined. Failure to breach the $0.242 – $0.247 cluster could see sellers regain control, rotating price back toward the $0.221 weekly support. Losing that support on a closing basis would invalidate the current base-building structure. For now, the combination of whale accumulation and a constructive technical setup suggests a move above $0.247 would mark a significant trend shift rather than a routine bounce.
The above content was completed with the assistance of AI and has been reviewed by an editor.
Disclaimer: The content available on Mitrade Insights is provided for informational and marketing purposes only. It has not been prepared in accordance with legal requirements designed to promote the independence of investment research and is not subject to any prohibition on dealing ahead of the dissemination of investment research.
Nothing in this material constitutes investment advice, personal recommendation, investment research, an offer, or a solicitation to buy or sell any financial instrument. The content has been prepared without consideration of your individual investment objectives, financial situation, or needs, and should not be treated as such.
Past performance is not a reliable indicator of future performance and/or results. Forward-looking scenarios or forecasts are not a guarantee of future performance. Actual results may differ materially from those anticipated.
Mitrade makes no representation or warranty as to the accuracy or completeness of the information provided and accepts no liability for any loss arising from reliance on such information.


