

HDFC Bank Ltd Stock (HDB) Moved Down by 3.22% on Mar 18: What Signal Does It Send?
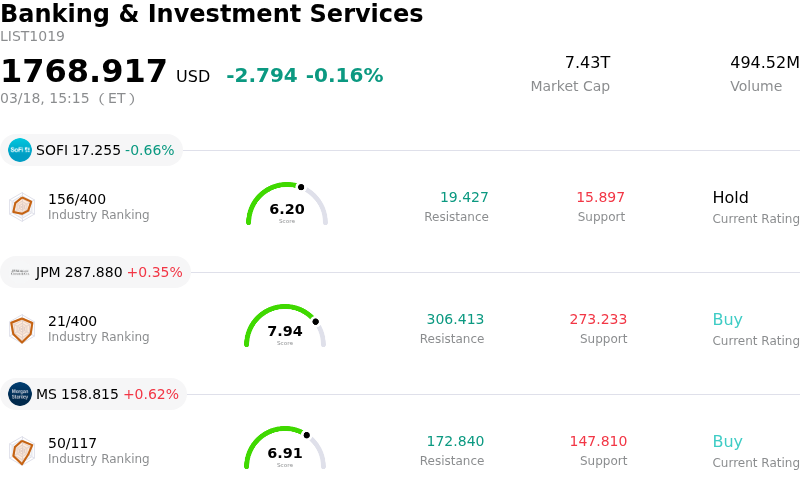
HDFC Bank Ltd (HDB) moved down by 3.22%. The Banking & Investment Services sector is down by 0.16%. The company underperformed the industry. Top 3 stocks by turnover in the sector: SoFi Technologies Inc (SOFI) down 0.66%; JPMorgan Chase & Co (JPM) up 0.35%; Morgan Stanley (MS) up 0.62%.
What is driving HDFC Bank Ltd (HDB)’s stock price down today?
HDB experienced a decline in share price today, largely influenced by an adjustment in analyst forecasts. Jefferies, a prominent financial firm, maintained a 'Buy' rating on HDB Financial Services Ltd., but simultaneously trimmed its target price. This reduction in the target price was attributed to anticipated near-term growth headwinds for the company, despite expectations for gradual improvement in the outlook over the medium term. Such a revision in future price expectations by analysts can trigger selling pressure as investors reassess the stock's potential.
The market's reaction also reflects a broader cautious sentiment among analysts towards HDFC Bank. While some reports highlight strong underlying financial performance and constructive guidance on growth and asset quality, bearish technical signals, such as the price trading below key moving averages, have been noted. Moreover, the consensus rating from other Wall Street analysts for HDB leans towards "Reduce," with some firms having recently downgraded the stock. This overall mixed-to-cautious analyst outlook, coupled with a specific target price cut today, contributed to the intraday volatility and downward movement.
Despite these near-term concerns, Jefferies notes that demand has remained robust in the recent quarter, and assets under management growth is expected to stabilize before gaining momentum in the coming fiscal years. HDB Financial Services also recently reported strong Q3 FY26 results, with significant profit and net interest income growth, showcasing healthy operational performance. Additionally, HDFC Bank itself recently retained top credit ratings in India, affirming its strong credit profile and access to funding. These positive fundamental aspects indicate that the current dip may be a reaction to recalibrated near-term expectations rather than a reflection of deteriorating long-term prospects.
Technical Analysis of HDFC Bank Ltd (HDB)
Technically, HDFC Bank Ltd (HDB) shows a MACD (12,26,9) value of [-1.02], indicating a sell signal. The RSI at 29.04 suggests sell condition and the Williams %R at -84.19 suggests oversold condition. Please monitor closely.
Fundamental Analysis of HDFC Bank Ltd (HDB)
HDFC Bank Ltd (HDB) is in the Banking & Investment Services industry. Its latest annual revenue is $33.77B, ranking 13 in the industry. The net profit is $8.38B, ranking 11 in the industry. Company Profile
Over the past month, multiple analysts have rated the company as Buy, with an average price target of $42.70, a high of $47.00, and a low of $35.30.
More details about HDFC Bank Ltd (HDB)
Company Specific Risks:
- Sustained selling pressure from Foreign Institutional Investors (FIIs) has driven HDFC Bank Ltd (HDB) stock to a 52-week low, contributing to its underperformance against broader market indices.
- HDFC Bank faces persistent challenges in improving Net Interest Margins (NIMs) due to a widening gap between credit growth and deposit growth, which could lead to increased funding costs.
- Ongoing complexities and potential delays in realizing synergies from the HDFC Ltd. merger pose risks to operational efficiency and investor confidence.
- HDB Financial Services Ltd, a key subsidiary, has fallen to a new 52-week low amidst broader sectoral pressures, regulatory scrutiny, and macroeconomic factors impacting credit demand and asset quality within the Non-Banking Financial Company (NBFC) sector.
Nothing in this material constitutes investment advice, personal recommendation, investment research, an offer, or a solicitation to buy or sell any financial instrument. The content has been prepared without consideration of your individual investment objectives, financial situation, or needs, and should not be treated as such.
Past performance is not a reliable indicator of future performance and/or results. Forward-looking scenarios or forecasts are not a guarantee of future performance. Actual results may differ materially from those anticipated.
Mitrade makes no representation or warranty as to the accuracy or completeness of the information provided and accepts no liability for any loss arising from reliance on such information.
Recommended Articles


