

Goldman Sachs Group Inc Stock (GS) Moved Down by 3.86% on Mar 27: A Full Analysis
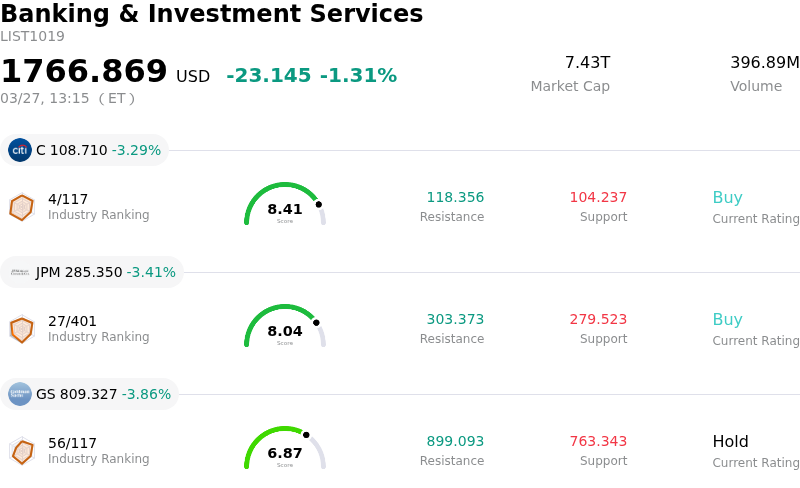
Goldman Sachs Group Inc (GS) moved down by 3.86%. The Banking & Investment Services sector is down by 1.31%. The company underperformed the industry. Top 3 stocks by turnover in the sector: Citigroup Inc (C) down 3.29%; JPMorgan Chase & Co (JPM) down 3.41%; Goldman Sachs Group Inc (GS) down 3.86%.
What is driving Goldman Sachs Group Inc (GS)’s stock price down today?
Goldman Sachs (GS) experienced a notable decline in its share price today amid a broad market selloff influenced by mounting macroeconomic and geopolitical concerns. The broader United States stock market opened with a significant downturn, with investor sentiment notably dampened by developments stemming from the ongoing Middle East conflict. This geopolitical instability is fueling increased inflation expectations, particularly due to oil supply shocks, and is leading to anticipations of prolonged higher interest rates as the Federal Reserve is expected to delay rate cuts until clear progress on inflation is achieved.
The firm itself recently raised its forecast for a U.S. recession probability, directly attributing this to the Middle East war's impact on oil supply and the subsequent higher inflation outlook. This internal assessment likely contributed to investor apprehension. Furthermore, recent data indicated a substantial drop in U.S. consumer sentiment during March, reaching its lowest point in several months, with a pronounced negative impact on higher-income consumers. Such a decline in consumer confidence can signal reduced economic activity, which poses headwinds for financial institutions heavily involved in investment banking and wealth management.
Company-specific risks also appear to be playing a role in the downward pressure. Concerns regarding elevated private-market markdown risk have been voiced, potentially affecting Goldman Sachs’ exposures in these areas and its asset management portfolios. Adding to this sentiment, recent reports highlighted that a number of company insiders sold shares, which can sometimes be interpreted as a negative signal to the market. While there was some positive news earlier in the month regarding the company's strategic expansion into stable fee-based businesses and increased dealmaking expectations, the pervasive macroeconomic and geopolitical uncertainties appear to be outweighing these factors in the short term. The overall market is reacting to increased volatility and a cautious outlook, with equity indices under pressure due to the unresolved conflict.
Technical Analysis of Goldman Sachs Group Inc (GS)
Technically, Goldman Sachs Group Inc (GS) shows a MACD (12,26,9) value of [-23.48], indicating a neutral signal. The RSI at 43.00 suggests neutral condition and the Williams %R at -43.25 suggests oversold condition. Please monitor closely.
Fundamental Analysis of Goldman Sachs Group Inc (GS)
Goldman Sachs Group Inc (GS) is in the Banking & Investment Services industry. Its latest annual revenue is $117.10B, ranking 2 in the industry. The net profit is $16.30B, ranking 1 in the industry. Company Profile
Over the past month, multiple analysts have rated the company as Hold, with an average price target of $962.28, a high of $1125.00, and a low of $614.29.
More details about Goldman Sachs Group Inc (GS)
Company Specific Risks:
- Concerns regarding potential widespread asset devaluation in private markets due to the continuous accumulation of unsold and possibly overvalued private assets, as warned by former Goldman Sachs CEO Lloyd Blankfein on March 26, 2026.
- Exposure to ongoing private credit market stress, which could negatively impact Goldman Sachs' financial performance and lending activities.
- Vulnerability to macroeconomic headwinds, including elevated oil volatility, inflation concerns, and a rising risk of a broader market correction, posing a threat to the firm's trading revenues and overall business environment.
- Analyst commentary on March 26, 2026, indicating "clear signs of ongoing weakness" and "bearish momentum" for Goldman Sachs, suggesting a need for a "defensive stance into earnings" amid elevated volatility and selling pressure.
Nothing in this material constitutes investment advice, personal recommendation, investment research, an offer, or a solicitation to buy or sell any financial instrument. The content has been prepared without consideration of your individual investment objectives, financial situation, or needs, and should not be treated as such.
Past performance is not a reliable indicator of future performance and/or results. Forward-looking scenarios or forecasts are not a guarantee of future performance. Actual results may differ materially from those anticipated.
Mitrade makes no representation or warranty as to the accuracy or completeness of the information provided and accepts no liability for any loss arising from reliance on such information.
Recommended Articles


