CFDs are complex instruments and come with a high risk of losing money rapidly due to leverage. 74% of retail investor accounts lose money when trading CFDs with this provider. You should consider whether you understand how CFDs work and whether you can afford to take the high risk of losing your money.

Litecoin Price Forecast: Bearish sentiment builds as correction looms below $50

Source Fxstreet
  • Litecoin trades in the red on Thursday, facing resistance around the key level.
  • Derivatives data supports a bearish sentiment with falling open interest alongside rising short bets.
  • The technical outlook suggests a correction ahead, targeting levels below $50.

Litecoin (LTC) is trading in the red, slipping below $58 at the time of writing on Thursday, and faces rejection at a key level. Weakening derivatives metrics support a bearish sentiment, while technical analysis suggests a deeper correction in the near term.

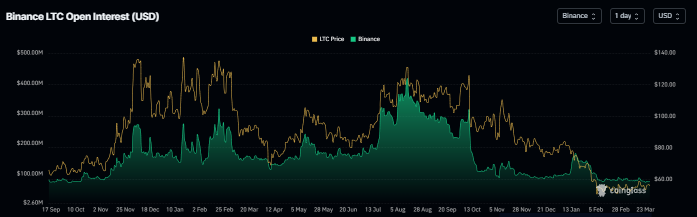
Fading investor participation

Litecoin’s futures Open Interest (OI) at Binance exchange dropped to $74.69 million on Thursday and has been continuously falling since mid-January. This drop in OI reflects waning investor participation and projects a bearish outlook.

LTC open interest on Binance chart. Source: Coinglass

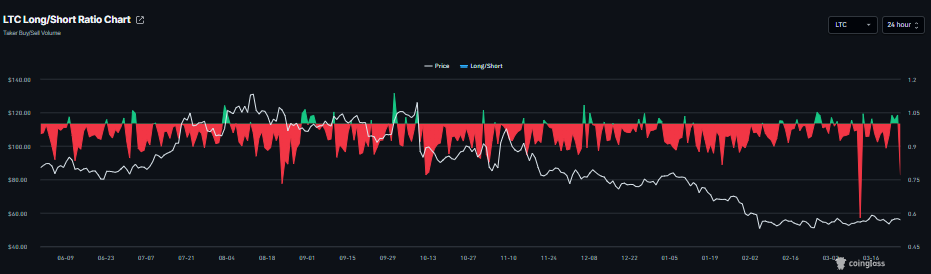
In addition, CoinGlass’s LTC long-to-short ratio, currently at 0.76 on Thursday, is near its lowest level in over a month. This ratio, below one, reflects bearish sentiment in the markets, as more traders are betting on the asset price to fall.

LTC long-to-short ratio chart. Source: Coinglass

Litecoin Price Forecast: LTC momentum indicators show early signs of weakness

Litecoin is trading below $58 at the time of writing on Thursday. The near‑term bias is mildly bearish, as the price is being rejected near the 50-day EMA at $57.50. 

The Relative Strength Index (RSI) on the daily chart is near the midline at 50 and pointing downward, indicating fading bullish strength. The Moving Average Convergence Divergence (MACD) line stays above the signal line and just above the zero mark, and the positive histogram, although modest, suggests fading bullish pressure.

Initial resistance lies at the nearby 50-day EMA at $57.80, with a horizontal barrier around $58.49 as the next upside level if buyers regain control. 

On the downside, immediate support emerges at the 23.6% retracement near $54.47, protecting the lower zone ahead of the more distant horizontal support at $50.54. A daily close above $58.49 would strengthen the bullish bias toward $60.28, while a drop through $54.47 would expose $50.54 and suggest deeper weakness toward the February 6 low of $45.07.

(The technical analysis of this story was written with the help of an AI tool.)

Disclaimer: The content available on Mitrade Insights is provided for informational and marketing purposes only. It has not been prepared in accordance with legal requirements designed to promote the independence of investment research and is not subject to any prohibition on dealing ahead of the dissemination of investment research
Nothing in this material constitutes investment advice, personal recommendation, investment research, an offer, or a solicitation to buy or sell any financial instrument. The content has been prepared without consideration of your individual investment objectives, financial situation, or needs, and should not be treated as such.
Past performance is not a reliable indicator of future performance and/or results. Forward-looking scenarios or forecasts are not a guarantee of future performance. Actual results may differ materially from those anticipated.
Mitrade makes no representation or warranty as to the accuracy or completeness of the information provided and accepts no liability for any loss arising from reliance on such information.
placeholder
Pi Network Price Annual Forecast: PI set for rocky 2026 as community eyes real-world utilityPi Network (PI) crashed by over 90% in 2025 from its all-time high of $3.00, with minor recovery along the way. The downfall was fueled by low investor confidence as mainnet migrations increased token deposits on Know Your Business (KYB) verified exchanges. 
Author  FXStreet
Dec 19, 2025
Pi Network (PI) crashed by over 90% in 2025 from its all-time high of $3.00, with minor recovery along the way. The downfall was fueled by low investor confidence as mainnet migrations increased token deposits on Know Your Business (KYB) verified exchanges. 
placeholder
USD/CHF ticks up to near 0.7900 as US Dollar edges higherThe USD/CHF pair edges up to near 0.7900 during the late Asian trading session on Monday. The Swiss Franc pair trades mildly higher as the US Dollar (USD) ticks up, with the US Dollar Index (DXY) rising to near 98.15.
Author  FXStreet
Dec 29, 2025
The USD/CHF pair edges up to near 0.7900 during the late Asian trading session on Monday. The Swiss Franc pair trades mildly higher as the US Dollar (USD) ticks up, with the US Dollar Index (DXY) rising to near 98.15.
placeholder
Cardano Price Forecast: ADA bulls bet on rising DEX trading volumeCardano (ADA) ticks higher by almost 4% at press time on Monday, approaching the $0.40 mark. Derivatives data suggests a risk-on sentiment among traders as ADA futures Open Interest and bullish bets surge.
Author  FXStreet
Dec 29, 2025
Cardano (ADA) ticks higher by almost 4% at press time on Monday, approaching the $0.40 mark. Derivatives data suggests a risk-on sentiment among traders as ADA futures Open Interest and bullish bets surge.
placeholder
HYPE gains, XRP extends losses amid Ripple Prime-Hyperliquid integrationRipple Prime, the institutional prime brokerage platform of Ripple, has integrated Hyperliquid (HYPE) in an effort to expand into the decentralized finance landscape.
Author  FXStreet
Feb 05, Thu
Ripple Prime, the institutional prime brokerage platform of Ripple, has integrated Hyperliquid (HYPE) in an effort to expand into the decentralized finance landscape.
placeholder
Financial Markets 2026: Volatility Catalysts in Gold, Silver, Oil, and Blue-Chip Stocks—A CFD Trader's OutlookThe financial world is perpetually in motion, but the landscape for 2026 seems to be shaping up to be particularly dynamic. For CFD traders navigating global markets, this heightened volatility could present a distinctive set of challenges and opportunities.
Author  Rachel Weiss
Mar 05, Thu
The financial world is perpetually in motion, but the landscape for 2026 seems to be shaping up to be particularly dynamic. For CFD traders navigating global markets, this heightened volatility could present a distinctive set of challenges and opportunities.
Related Instrument
goTop
quote