

USD/JPY Price Forecast: Extends advance but stalls near 159.50
- USD/JPY posts consecutive gains after bouncing from 20-day SMA support.
- RSI signals bullish momentum, pointing toward retest of weekly highs.
- Failure to clear 159.65 keeps focus on downside support levels.
The USD/JPY registers back-to-back bullish days after testing key support at the 20-day Simple Moving Average (SMA) around 158.24 on Monday, yet it remains shy of clearing the key weekly high of 159.65 hit on March 23. At the time of writing, the pair trades at 159.27, up 0.36%.
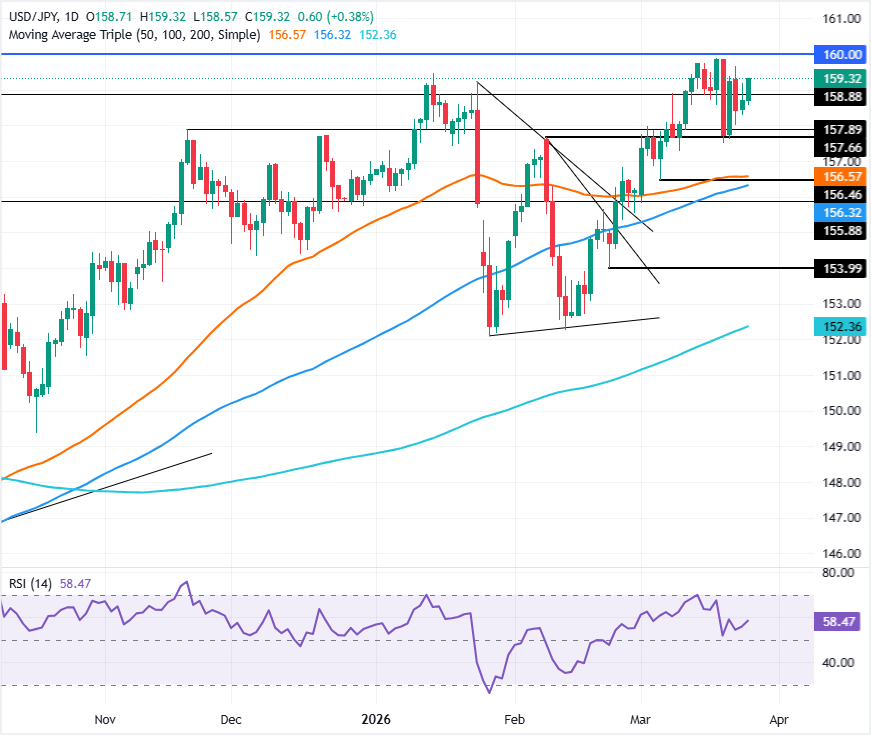
USD/JPY Price Forecast: Technical Outlook
The technical picture suggests that the USD/JPY might retest weekly highs in the short term. Momentum, as measured by the Relative Strength Index (RSI), confirms the latter. Still, fears of Japanese authorities intervening in the FX markets could prevent USD bulls from pushing the pair towards the 160.00 milestone.
On the downside, the first area of interest is the 20-day SMA at 158.24. Once surpassed, it opens the door to challenging the March 19 daily low of 157.51, as the 50-day SMA emerges as the next key line of defense for bulls at around 156.56.
On further weakness, the next support would be the 100-day SMA at 156.26, ahead of 156.00.
USD/JPY Price Chart — Daily
Japanese Yen Price This week
The table below shows the percentage change of Japanese Yen (JPY) against listed major currencies this week. Japanese Yen was the strongest against the Canadian Dollar.
| USD | EUR | GBP | JPY | CAD | AUD | NZD | CHF | |
|---|---|---|---|---|---|---|---|---|
| USD | -0.32% | -0.47% | -0.03% | 0.66% | 0.57% | 0.07% | 0.36% | |
| EUR | 0.32% | -0.14% | 0.33% | 1.00% | 0.89% | 0.40% | 0.70% | |
| GBP | 0.47% | 0.14% | 0.40% | 1.16% | 1.05% | 0.54% | 0.77% | |
| JPY | 0.03% | -0.33% | -0.40% | 0.65% | 0.58% | 0.08% | 0.28% | |
| CAD | -0.66% | -1.00% | -1.16% | -0.65% | -0.07% | -0.58% | -0.31% | |
| AUD | -0.57% | -0.89% | -1.05% | -0.58% | 0.07% | -0.50% | -0.28% | |
| NZD | -0.07% | -0.40% | -0.54% | -0.08% | 0.58% | 0.50% | 0.23% | |
| CHF | -0.36% | -0.70% | -0.77% | -0.28% | 0.31% | 0.28% | -0.23% |
The heat map shows percentage changes of major currencies against each other. The base currency is picked from the left column, while the quote currency is picked from the top row. For example, if you pick the Japanese Yen from the left column and move along the horizontal line to the US Dollar, the percentage change displayed in the box will represent JPY (base)/USD (quote).
Nothing in this material constitutes investment advice, personal recommendation, investment research, an offer, or a solicitation to buy or sell any financial instrument. The content has been prepared without consideration of your individual investment objectives, financial situation, or needs, and should not be treated as such.
Past performance is not a reliable indicator of future performance and/or results. Forward-looking scenarios or forecasts are not a guarantee of future performance. Actual results may differ materially from those anticipated.
Mitrade makes no representation or warranty as to the accuracy or completeness of the information provided and accepts no liability for any loss arising from reliance on such information.
Recommended Articles


