

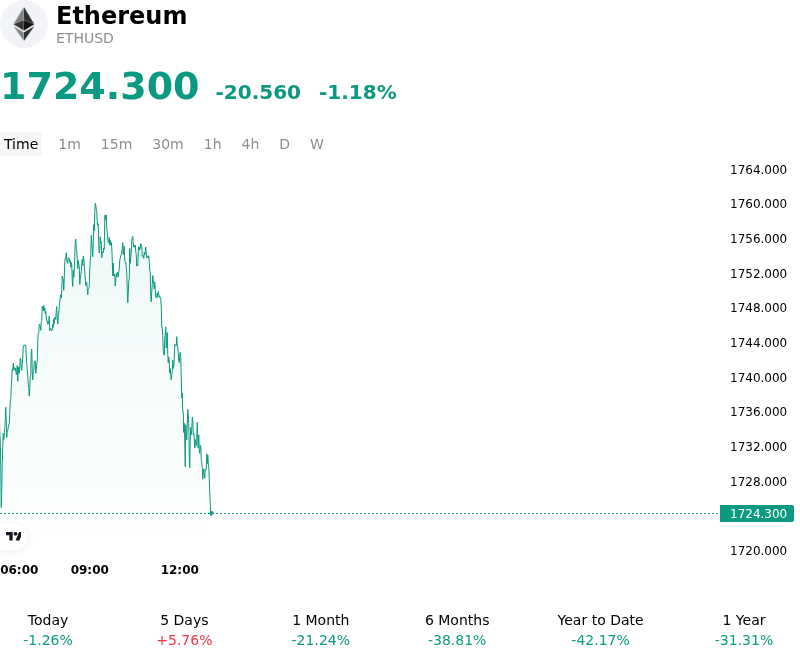
Ethereum (ETHUSD) Is down 1.18% on Jun 18: What Do On-Chain Data and Market Sentiment Show?
Ethereum (ETHUSD) is down 1.18% at Jun 18 01:05(ET), now at $1724.3, with a 7-day up of 3.21%.
What is driving Ethereum (ETHUSD)’s stock price down today?
The primary driver of the downward pressure on Ethereum is a significant shift in macroeconomic expectations following the Federal Reserve’s June monetary policy meeting. While the central bank kept interest rates unchanged, the accompanying economic projections and dot plot delivered an unexpectedly hawkish shock to risk markets. Under the leadership of the newly appointed Fed Chair, Kevin Warsh, policymakers raised the median year-end interest rate forecast and signaled that further rate hikes, rather than cuts, are now on the table before the end of the year. This hawkish pivot, alongside an upward revision to PCE inflation forecasts driven by global energy-supply concerns, has severely dampened investor expectations for near-term monetary easing, driving capital out of risk-sensitive assets.
Beyond macroeconomic tightening, Ethereum is facing several asset-specific structural headwinds. Spot Ethereum exchange-traded funds have continued to show tepid demand, marked by stagnant institutional inflows that contrast with more resilient capital allocation into other digital assets. This institutional caution is exacerbated by the postponement of the highly anticipated Glamsterdam mainnet upgrade to the second half of the year. The delay has temporarily halted momentum around major protocol updates like execution-peer-DAS and gas repricing, leaving the network without a strong near-term catalyst to revive the broader ecosystem narrative.
Furthermore, on-chain dynamics have put pressure on Ethereum's economic model. The persistent migration of transactional activity to Layer-2 scaling solutions has successfully boosted transaction counts but has significantly reduced Layer-1 mainnet gas fees. This reduction has slowed down the network's token-burning mechanism, weakening the deflationary "ultrasound money" narrative that previously underpinned Ethereum's premium valuation. With fee-burning at depressed levels, the long-term investment case based on structural supply contraction is facing increased skepticism from macro allocators.
Finally, the decline was aggravated by derivative market positioning and localized on-chain vulnerabilities. High-leverage long positioning on centralized exchanges created a fragile liquidity environment, making the market susceptible to cascading liquidations as key price levels were tested. This technical pressure was further worsened by recent DeFi security exploits, which led to immediate selling pressure on decentralized exchanges as bad actors liquidated compromised assets. As market sentiment deteriorates deeper into extreme fear, the combination of tight global liquidity and structural network challenges continues to limit Ethereum's immediate upside potential.
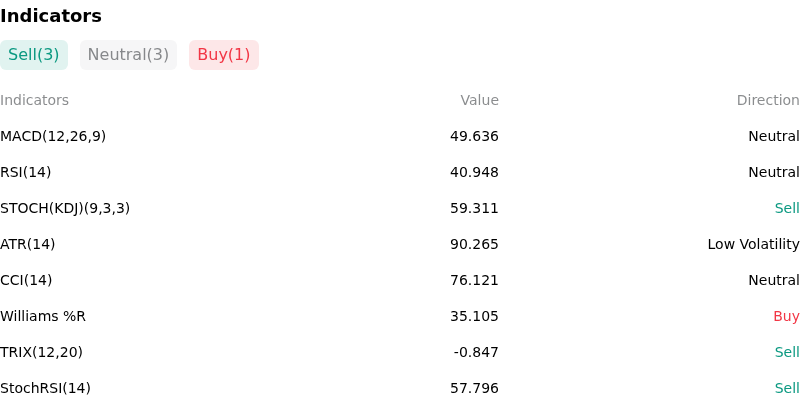
Technical Analysis of Ethereum (ETHUSD)
Technically, Ethereum (ETHUSD) shows a MACD (12,26,9) value of 49.636, indicating a neutral signal. The RSI at 40.948 suggests neutral condition and the Williams %R at 35.105 suggests buy condition. Please monitor closely.
More details about Ethereum (ETHUSD)
Recent Events and Risks:
- Unprecedented Spot ETF Outflows: U.S. spot Ethereum ETFs have recorded an historic 17-day streak of consecutive daily net outflows, compounding on a record $401 million in net redemptions in May. This severe withdrawal of institutional capital has stripped the spot market of structural buying pressure, causing ETH to repeatedly fail to sustain rallies above key resistance zones.
- Severely Damaged Technical Structure: ETHUSD is locked in a structural bearish trend on the daily chart, trading firmly below its 20-day ($1,794), 50-day ($1,961), and 200-day ($2,448) Exponential Moving Averages (EMAs). Price action has compressed within a narrow $44 range (between $1,754 and $1,798), increasing the risk of a high-volatility breakdown toward the $1,650 support zone or the $1,500 psychological floor.
- Hawkish Federal Reserve Projection: Global risk-off sentiment has intensified following the Federal Reserve's June policy meeting, where officials surprised markets by projecting additional interest rate hikes for late 2026. This hawkish stance has dampened risk-on appetite and locked the crypto market in a state of "Extreme Fear" (Fear & Greed Index at 23), driving capital rotation out of Ethereum.
- Derivatives Leverage and Liquidation Exposure: While spot demand remains weak, Ethereum derivatives show a build-up in leverage, with Binance futures open interest hovering near $5.54 billion. Having recently experienced a massive network-wide liquidation event, any breach of the immediate $1,754 support level exposes highly leveraged positions to another cascading wave of forced automated selling.
Nothing in this material constitutes investment advice, personal recommendation, investment research, an offer, or a solicitation to buy or sell any financial instrument. The content has been prepared without consideration of your individual investment objectives, financial situation, or needs, and should not be treated as such.
Past performance is not a reliable indicator of future performance and/or results. Forward-looking scenarios or forecasts are not a guarantee of future performance. Actual results may differ materially from those anticipated.
Mitrade makes no representation or warranty as to the accuracy or completeness of the information provided and accepts no liability for any loss arising from reliance on such information.
Recommended Articles


