



IONQ Inc Stock (IONQ) Moved Down by 7.48% on Aug 24: What Signal Does It Send?
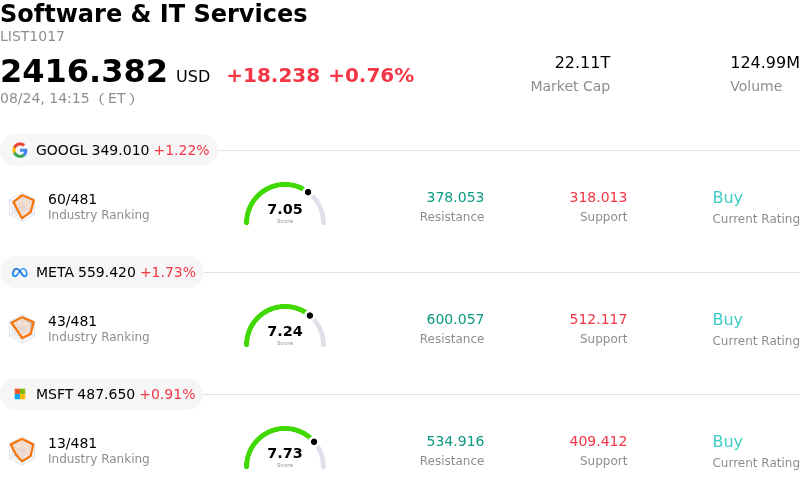
IONQ Inc (IONQ) moved down by 7.48%. The Software & IT Services sector is up by 0.76%. The company underperformed the industry. Top 3 stocks by turnover in the sector: Alphabet Inc Class A (GOOGL) up 1.22%; Meta Platforms Inc (META) up 1.73%; Microsoft Corp (MSFT) up 0.91%.
What is driving IONQ Inc (IONQ)’s stock price down today?
IonQ experienced a pronounced downward movement driven primarily by a sector-wide decline across pure-play quantum computing equities. Following a strong upward trend fueled by second-quarter revenue updates and headline-driven excitement across the industry, market sentiment shifted toward de-risking and profit-taking. This basket-wide pullback affected several industry peers simultaneously, indicating that the movement was largely sentiment-driven rather than triggered by any single negative company-specific catalyst. Investors unwound speculative momentum across early-stage technology stocks as market participants reassessed post-earnings valuation multiples.
Beyond broader industry profit-taking, market scrutiny remains focused on the company's valuation and ongoing path toward commercial profitability. Although IonQ recently delivered impressive top-line growth, raised its full-year revenue outlook, and highlighted operational progress—such as satellite deployments through its optical technology unit—the company continues to post operating losses and heavy cash burn. Its elevated valuation relative to fundamental cash flows leaves the stock particularly sensitive to broader market swings and shifting macroeconomic conditions. Furthermore, insider net selling disclosed in recent regulatory filings and persistent caution surrounding capital requirements have weighed on investor sentiment during risk-off sessions.
From an institutional strategy standpoint, the trading action underscores the high volatility inherent in commercializing quantum computing technologies. While long-term revenue visibility, expanding enterprise partnerships, and multi-product momentum provide a solid foundation for fundamental growth, short-term equity pricing remains vulnerable to sector sentiment cycles and broader rate environment dynamics. Investors are increasingly demanding clear execution on commercialization and margin improvements, keeping speculative growth names under tighter scrutiny.
Technical Analysis of IONQ Inc (IONQ)
Technically, IONQ Inc (IONQ) shows a MACD (12,26,9) value of 0.675, indicating a buy signal. The RSI at 47.894 suggests neutral condition and the Williams %R at 77.865 suggests sell condition. Please monitor closely.
Fundamental Analysis of IONQ Inc (IONQ)
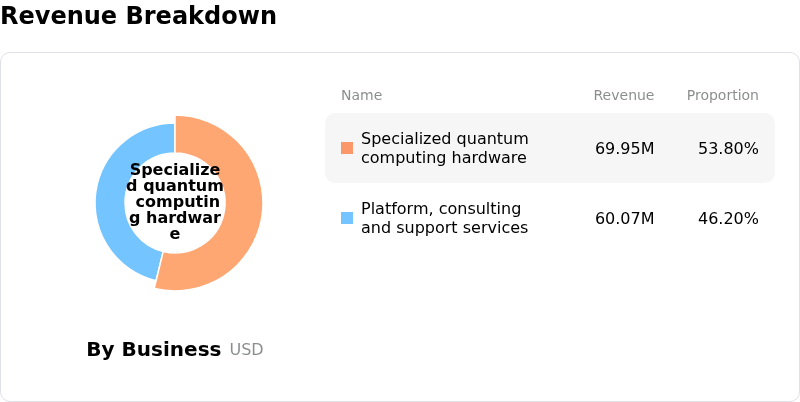
IONQ Inc (IONQ) is in the Software & IT Services industry. Its latest annual revenue is $130.02M, ranking 375 in the industry. The net profit is $-510.38M, ranking 592 in the industry. Company Profile
Over the past month, multiple analysts have rated the company as Buy, with an average price target of $71.23, a high of $100.00, and a low of $49.00.
More details about IONQ Inc (IONQ)
Company Specific Risks:
- Severe GAAP Net Loss from Warrant Liabilities: SEC Form 8-K and 10-Q filings report a massive Q2 GAAP net loss of $1.87 billion, driven primarily by a $1.58 billion loss on fair value changes of warrant liabilities alongside escalating operational costs, reinforcing concerns over structural unprofitability.
- Persistent Insider Selling and Analyst Downgrades: Recent insider filings and Wall Street updates highlight over $12 million in net insider share sales over the past 12 months alongside analyst downgrades to "Strong Sell," signaling institutional caution regarding current executive confidence and valuation levels.
- Elevated Valuation and Multiple Compression Exposure: Trading at a Price-to-Sales multiple exceeding 60x with net margins below -500%, the stock faces severe intraday volatility as macro pressures and rising Treasury yields trigger aggressive sell-offs in speculative, unprofitable technology names.
- Widening Cash Losses and Integration Overhead: Following the integration of recent acquisitions like SkyWater, projected full-year adjusted EBITDA losses of $310 million to $330 million highlight severe cash burn and elevated R&D expenses, heightening long-term shareholder dilution risks.
Nothing in this material constitutes investment advice, personal recommendation, investment research, an offer, or a solicitation to buy or sell any financial instrument. The content has been prepared without consideration of your individual investment objectives, financial situation, or needs, and should not be treated as such.
Past performance is not a reliable indicator of future performance and/or results. Forward-looking scenarios or forecasts are not a guarantee of future performance. Actual results may differ materially from those anticipated.
Mitrade makes no representation or warranty as to the accuracy or completeness of the information provided and accepts no liability for any loss arising from reliance on such information.
Recommended Articles


