



Magna International Inc Stock (MGA) Moved Down by 7.35% on Aug 24: Facts Behind the Movement
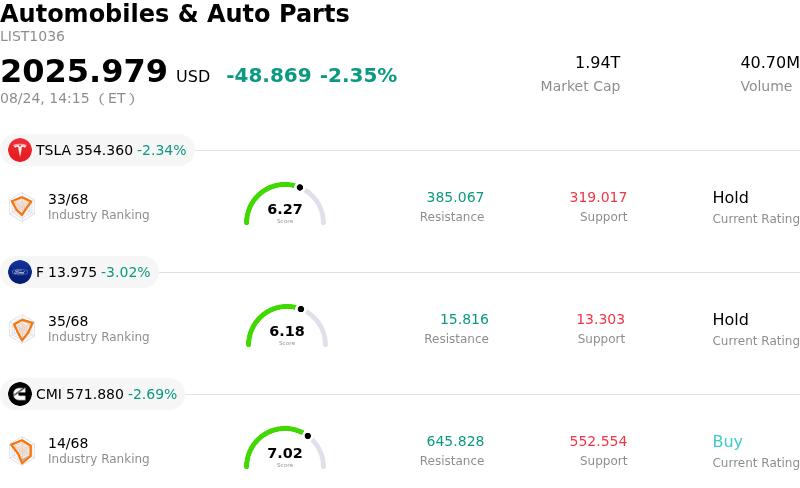
Magna International Inc (MGA) moved down by 7.35%. The Automobiles & Auto Parts sector is down by 2.35%. The company underperformed the industry. Top 3 stocks by turnover in the sector: Tesla Inc (TSLA) down 2.34%; Ford Motor Co (F) down 3.02%; Cummins Inc (CMI) down 2.69%.
What is driving Magna International Inc (MGA)’s stock price down today?
Magna International experienced a sharp intraday decline following a period of sustained upward momentum that had pushed the stock toward multi-month highs. After an extended rally fueled by stronger-than-expected second-quarter financial results, expanding operating margins, and an elevated full-year outlook, the equity faced concentrated selling pressure. This sudden reversal primarily reflects aggressive profit-taking by institutional investors, technical resistance at peak valuation levels, and broader profit-harvesting across the auto supplier space.
A key narrative weighing on market sentiment involves ongoing macro and trade policy uncertainties affecting the North American automotive sector. Given Magna's deeply integrated supply chain across the United States and Canada, the company remains uniquely exposed to cross-border tariff dynamics and trade negotiations. While recent market optimism had been built on expectations of durable bilateral tariff relief, renewed caution regarding trade agreement terms and potential supply chain disruptions prompted investors to reduce risk exposure in higher-beta cyclical stocks.
From a technical perspective, the sell-off was intensified by volume divergence during recent sessions as the stock reached overbought territory. Once key short-term support thresholds were breached during the session, momentum-driven selling and automated stop-loss executions accelerated the downward trajectory. Despite the temporary pullback, Magna's mid-to-long-term fundamental narrative remains anchored by robust cash generation, ongoing non-core asset divestitures, and active capital return programs.
Technical Analysis of Magna International Inc (MGA)
Technically, Magna International Inc (MGA) shows a MACD (12,26,9) value of -0.276, indicating a neutral signal. The RSI at 47.172 suggests neutral condition and the Williams %R at 92.169 suggests oversold condition. Please monitor closely.
Fundamental Analysis of Magna International Inc (MGA)
Magna International Inc (MGA) is in the Automobiles & Auto Parts industry. Its latest annual revenue is $42.01B, ranking 7 in the industry. The net profit is $829.00M, ranking 6 in the industry. Company Profile
Over the past month, multiple analysts have rated the company as Hold, with an average price target of $73.68, a high of $93.00, and a low of $55.00.
More details about Magna International Inc (MGA)
Company Specific Risks:
- U.S.-Canada Tariff & Cross-Border Supply Risks: Renewed U.S.-Canada trade friction and potential 50% tariffs on Canadian auto exports pose immediate cross-border supply chain disruptions and input cost pressure for Magna's North American operations.
- Full-Year Revenue Guidance Reduction: Management trimmed FY2026 revenue expectations to $41.3B–$42.5B, highlighting persistent volume declines in the Complete Vehicles assembly segment alongside foreign exchange headwinds.
- OEM Customer Concentration Vulnerability: Over 75% of total revenue is concentrated in Detroit Three and German automakers, leaving the company heavily exposed to vehicle production cutbacks, EV program delays, and commercial pricing pressures.
- Thin Margin Exposure to Commodity and Recovery Delays: Operating with slim net profit margins, Magna faces heightened earnings exposure if commodity inflation persists or if commercial settlements and tariff cost reimbursements from OEM clients stall.
Nothing in this material constitutes investment advice, personal recommendation, investment research, an offer, or a solicitation to buy or sell any financial instrument. The content has been prepared without consideration of your individual investment objectives, financial situation, or needs, and should not be treated as such.
Past performance is not a reliable indicator of future performance and/or results. Forward-looking scenarios or forecasts are not a guarantee of future performance. Actual results may differ materially from those anticipated.
Mitrade makes no representation or warranty as to the accuracy or completeness of the information provided and accepts no liability for any loss arising from reliance on such information.
Recommended Articles


