



BNB (BNBUSD) Is up 1.87% on Aug 25: What Do On-Chain Data and Market Sentiment Show?
BNB (BNBUSD) is up 1.87% at Aug 25 00:15(ET), now at $714.3, with a 7-day up of 18.87%.
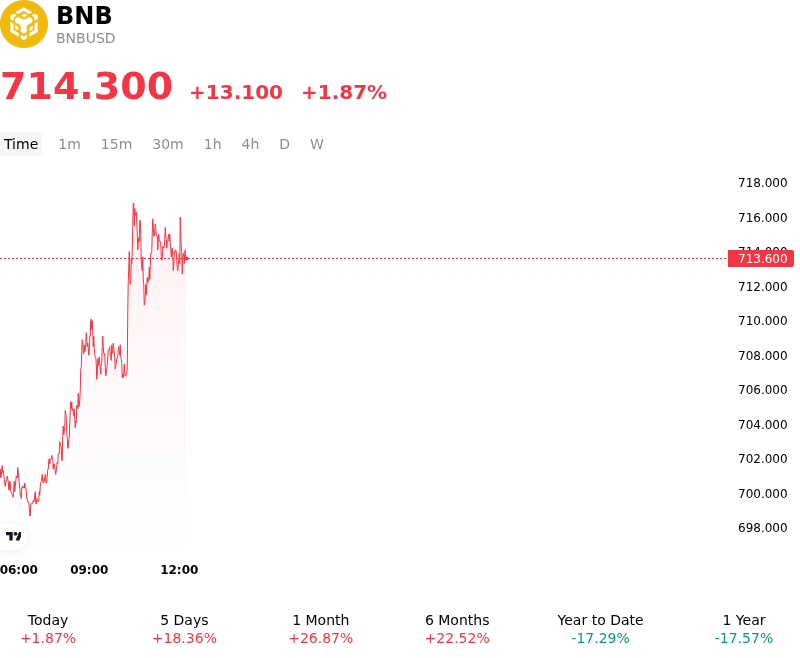
What is driving BNB (BNBUSD)’s stock price up today?
The activation of the Pasteur hard fork on the BNB Chain mainnet served as a key technical catalyst, boosting institutional and retail investor confidence through enhancements to transaction throughput, cross-chain bridge security, and validator governance. Concurrently, expanding institutional presence provided structural support, highlighted by fund rebalancings such as Grayscale assigning a prominent weighting to BNB within its smart contract asset allocations. These protocol advancements and institutional endorsements strengthened medium-term utility expectations, encouraging capital deployment into the token as market participants priced in improved network scalability.
On-chain liquidity dynamics and decentralized finance positioning further accelerated upward price momentum. On-chain data revealed pronounced leverage building across ecosystem lending protocols, notably on Venus Protocol, where large-scale holders collateralized existing holdings to acquire additional spot BNB. This leveraged accumulation tightened liquid market supply on major exchanges, absorbing overhead liquidity near key resistance levels and forcing short derivative positions into systematic covering. The resulting liquidity feedback loop bolstered spot market depth and reinforced short-term bullish market structure.
Broader digital asset market sentiment and favorable macro liquidity conditions provided a supportive backdrop for the advance. As overall risk appetite across the cryptocurrency sector stabilized, capital rotated into top-tier Layer-1 network assets displaying clear ecosystem catalysts. While the combination of network upgrades, institutional integration, and localized leverage loops propelled the asset higher, professional investors continue to monitor broader market leverage concentration, global monetary policy expectations, and execution risks surrounding protocol transitions.
Technical Analysis of BNB (BNBUSD)
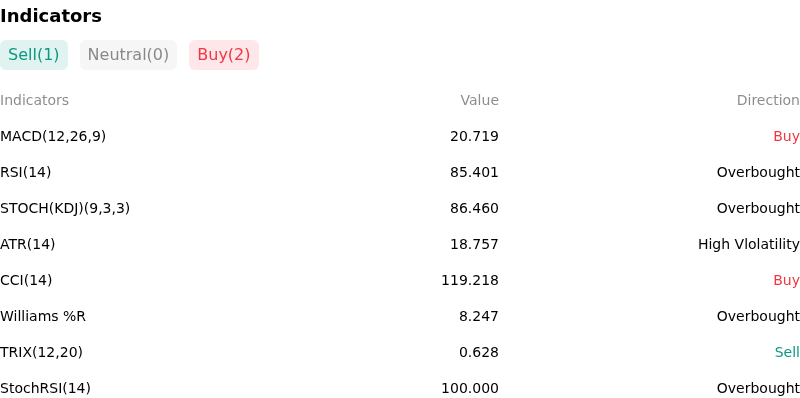
Technically, BNB (BNBUSD) shows a MACD (12,26,9) value of 20.719, indicating a buy signal. The RSI at 85.401 suggests overbought condition and the Williams %R at 8.247 suggests overbought condition. Please monitor closely.
More details about BNB (BNBUSD)
Recent Events and Risks:
- Strict Compliance Restrictions and Liquidity Friction: Binance implemented major transaction cutoffs restricting transfers to and from 11 targeted crypto service providers—including HTX and EXMO—under expanded EU, UK, and US sanctions compliance guidelines, introducing counterparty friction and increased risk of automated wallet review holds across ecosystem channels.
- Severe Overbought Momentum and Resistance Overhead: BNB's intraday breakout toward the $719–$725 zone pushed its daily Relative Strength Index (RSI) above 85 into extreme overbought territory, triggering profit-taking and raising downside risk toward lower technical support near $663.
- Mainnet Hard Fork Execution and Node Strains: The activation of the security-focused Pasteur hard fork across BNB Chain introduces temporary network execution risks, potential validator node desynchronization, and short-term transaction processing disruptions during implementation.
- European MiCA Licensing and Single-Passport Headwinds: Extended regulatory uncertainty surrounding Binance's ability to secure full cross-border authorization under the EU's MiCA framework continues to fuel legal friction and ecosystem concentration risks for BNB across key European jurisdictions.
Nothing in this material constitutes investment advice, personal recommendation, investment research, an offer, or a solicitation to buy or sell any financial instrument. The content has been prepared without consideration of your individual investment objectives, financial situation, or needs, and should not be treated as such.
Past performance is not a reliable indicator of future performance and/or results. Forward-looking scenarios or forecasts are not a guarantee of future performance. Actual results may differ materially from those anticipated.
Mitrade makes no representation or warranty as to the accuracy or completeness of the information provided and accepts no liability for any loss arising from reliance on such information.
Recommended Articles


