



Brent (UKOIL) Is down by 2.02% on Aug 25: Is the Demand Outlook Changing?
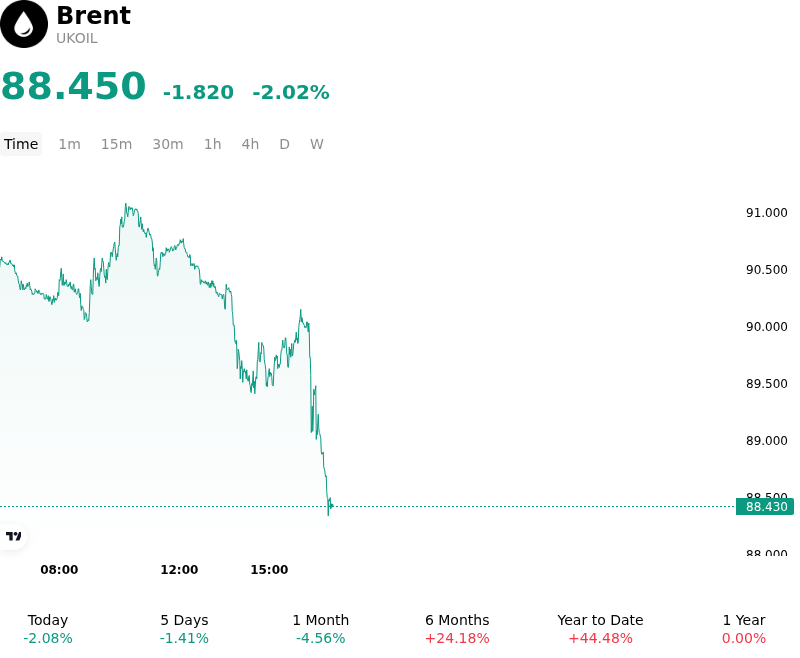
Brent (UKOIL) is down 2.02% at Aug 25 05:05(ET), now at $88.45, with a 7-day down of 1.48%.
What is driving Brent (UKOIL)’s stock price down today?
Brent crude experienced downside pressure as market participants engaged in widespread profit-taking following a multi-week rally to recent highs. The pullback was primarily driven by traders reassessing the immediate impact of newly announced U.S. sanctions aimed at tightening economic pressure on Iran. While geopolitical risk premiums stemming from Middle Eastern transit frictions had buoyed benchmark prices in prior sessions, the market largely shrugged off the latest escalation. Investors increasingly interpreted the policy measures as potentially opening a path toward diplomatic de-escalation or structured negotiations rather than causing an immediate, severe contraction in physical crude availability.
Underpinning the move was renewed scrutiny over underlying global physical demand. Despite ongoing headlines surrounding regional chokepoints, physical market indicators revealed that major buyers in Asia, particularly China, had managed crude intake cautiously, moderating aggressive spot purchases and dampening expectations of a tighter near-term supply-demand balance. Furthermore, market skepticism persisted regarding how strictly new regulatory measures would be enforced against major non-Western importers, preventing a fresh wave of supply-driven risk buying.
From a market structure and positioning perspective, the retreat reflected an unwinding of stretched speculative long positions near key resistance levels. Institutional capital flows shifted toward risk mitigation as traders locked in gains from the previous session's surge. Moving forward, investors remain focused on physical export volumes, refinery margin dynamics, and official inventory reports to evaluate whether the weakness marks a temporary event-driven consolidation or a broader fundamental repricing.
Technical Analysis of Brent (UKOIL)
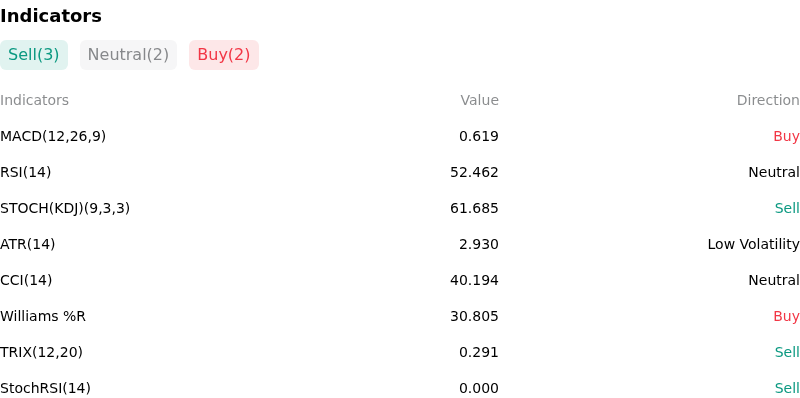
Technically, Brent (UKOIL) shows a MACD (12,26,9) value of 0.619, indicating a buy signal. The RSI at 52.462 suggests neutral condition and the Williams %R at 30.805 suggests buy condition. Please monitor closely.
More details about Brent (UKOIL)
Recent Events and Risks:
- Global Demand Forecast Downgrades: Major energy organizations, including OPEC and the International Energy Agency, have revised down 2026 global oil consumption projections due to persistent high fuel costs and ongoing demand destruction in key Asian importing markets.
- Massive U.S. Crude Inventory Build: Recent Energy Information Administration weekly data showed a massive, unexpected 17.4 million-barrel surge in U.S. commercial crude stockpiles, creating near-term physical oversupply pressure on front-month benchmark contracts.
- OPEC+ Output Expansion and Structural Surplus Concerns: Production increases across OPEC alliance members, combined with robust non-OPEC output growth from the Americas, are intensifying market concerns over a expanding global supply surplus.
- Macroeconomic Tightening and Risk-Off Sentiment: Elevated global interest rates and high sovereign bond yields continue to restrain industrial manufacturing and freight activity, triggering risk-off unwinds across commodity futures.
Nothing in this material constitutes investment advice, personal recommendation, investment research, an offer, or a solicitation to buy or sell any financial instrument. The content has been prepared without consideration of your individual investment objectives, financial situation, or needs, and should not be treated as such.
Past performance is not a reliable indicator of future performance and/or results. Forward-looking scenarios or forecasts are not a guarantee of future performance. Actual results may differ materially from those anticipated.
Mitrade makes no representation or warranty as to the accuracy or completeness of the information provided and accepts no liability for any loss arising from reliance on such information.
Recommended Articles


