



Bloom Energy Corp Stock (BE) Moved Up by 5.30% on Aug 25: Facts Behind the Movement
Bloom Energy Corp (BE) moved up by 5.30%. The Industrial Goods sector is down by 0.11%. The company outperformed the industry. Top 3 stocks by turnover in the sector: Bloom Energy Corp (BE) up 5.30%; Caterpillar Inc (CAT) up 0.02%; Eaton Corporation PLC (ETN) up 0.84%.
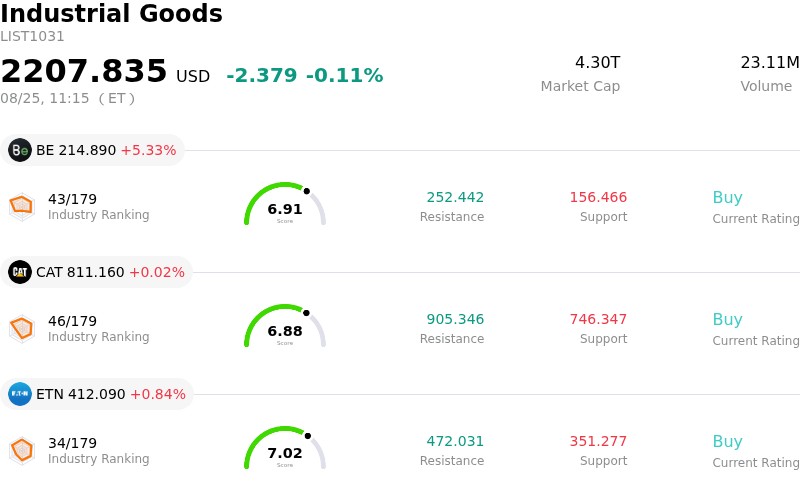
What is driving Bloom Energy Corp (BE)’s stock price up today?
Bloom Energy experienced notable upward momentum driven primarily by high-profile regulatory disclosures that reignited market enthusiasm around the clean energy and artificial intelligence infrastructure trade. Congressional financial filings revealed that a prominent political figure's household established a substantial new long-term stake in the company, acquiring common shares alongside bullish long-dated call options. The simultaneous disclosure of investments in major semiconductor partners—who serve as key enterprise customers for Bloom’s fuel-cell technology—reinforced the market narrative around growing institutional confidence in the firm’s strategic positioning within the AI power supply chain.
Underpinning this sentiment-driven surge is robust fundamental execution tied to the expanding power bottleneck facing modern data centers. Hyperscalers and neocloud operators increasingly rely on solid oxide fuel-cell microgrids to bypass years-long electrical grid interconnection delays. This structural tailwind was validated by the company’s recent quarterly financial results, where top-line revenue surged dramatically year-over-year to cross major historic thresholds, prompting management to elevate full-year performance guidance. Further fueling investor optimism, the recent launch of the Power Connect modular deployment platform has significantly reduced onsite installation timelines, enhancing operational scalability for large-scale computing facilities.
Despite the positive catalyst, the equity exhibited significant intraday volatility as market participants balanced powerful momentum signals against elevated valuation metrics. Having pulled back from peak levels reached earlier in the summer, the stock attracted aggressive buying interest from retail and institutional investors seeking exposure to energy infrastructure. However, premium forward valuation multiples and diverging institutional price targets indicate that sustained long-term performance will remain tightly linked to ongoing order backlog conversion and execution across contracted power capacity. In the near term, the convergence of strong corporate fundamentals, product releases, and high-visibility disclosures continues to position the company as a focal point in the AI energy transition.
Technical Analysis of Bloom Energy Corp (BE)
Technically, Bloom Energy Corp (BE) shows a MACD (12,26,9) value of 0.507, indicating a neutral signal. The RSI at 48.143 suggests neutral condition and the Williams %R at 57.020 suggests sell condition. Please monitor closely.
Fundamental Analysis of Bloom Energy Corp (BE)
Bloom Energy Corp (BE) is in the Industrial Goods industry. Its latest annual revenue is $2.02B, ranking 78 in the industry. The net profit is $-88.43M, ranking 208 in the industry. Company Profile
Over the past month, multiple analysts have rated the company as Buy, with an average price target of $270.66, a high of $380.00, and a low of $98.94.
More details about Bloom Energy Corp (BE)
Company Specific Risks:
- Supply Chain Transparency and Securities Class Action Litigation: On August 25, 2026, multiple legal notices highlighted ongoing investor class action litigation accusing Bloom Energy of misrepresenting its supply chain independence from China, citing investigative reports that traced Chinese scandium oxide and scandium-bearing ceramics into its Delaware facility, exposing the company to regulatory scrutiny and material legal liabilities.
- Extreme Valuation Multiples and High Beta Volatility: Trading at an inflated trailing price-to-earnings ratio above 270x and a price-to-sales ratio near 19x with a beta of 3.83, the stock exhibits high downside sensitivity. Significant divergence among institutional price targets—ranging from $105 to $354—reflects growing analyst debate over whether current valuations can withstand any cooling in artificial intelligence data center capital expenditure.
- Manufacturing Capacity Bottlenecks and Execution Risk: Despite aggressive guidance calling for full-year 2026 revenue of $3.9 billion to $4.2 billion, the company faces operational risk around scaling its solid oxide fuel cell manufacturing capacity fast enough to fulfill a $20 billion backlog without experiencing component sourcing delays or cost overruns.
- Headline-Driven Volatility and Speculative Flow Exposure: Sharp intraday price swings, including a wide trading range between $204 and $217 following congressional financial disclosure filings, underscore that the equity is currently prone to headline-driven retail and institutional momentum, leaving shares vulnerable to quick reversals once speculative sentiment fades.
Nothing in this material constitutes investment advice, personal recommendation, investment research, an offer, or a solicitation to buy or sell any financial instrument. The content has been prepared without consideration of your individual investment objectives, financial situation, or needs, and should not be treated as such.
Past performance is not a reliable indicator of future performance and/or results. Forward-looking scenarios or forecasts are not a guarantee of future performance. Actual results may differ materially from those anticipated.
Mitrade makes no representation or warranty as to the accuracy or completeness of the information provided and accepts no liability for any loss arising from reliance on such information.
Recommended Articles


