



XRP (XRPUSD) Suddenly Goes down 1.24% on Aug 26: What's Driving This
XRP (XRPUSD) is down 1.24% at Aug 26 01:20(ET), now at $1.4256, with a 7-day up of 29.71%.
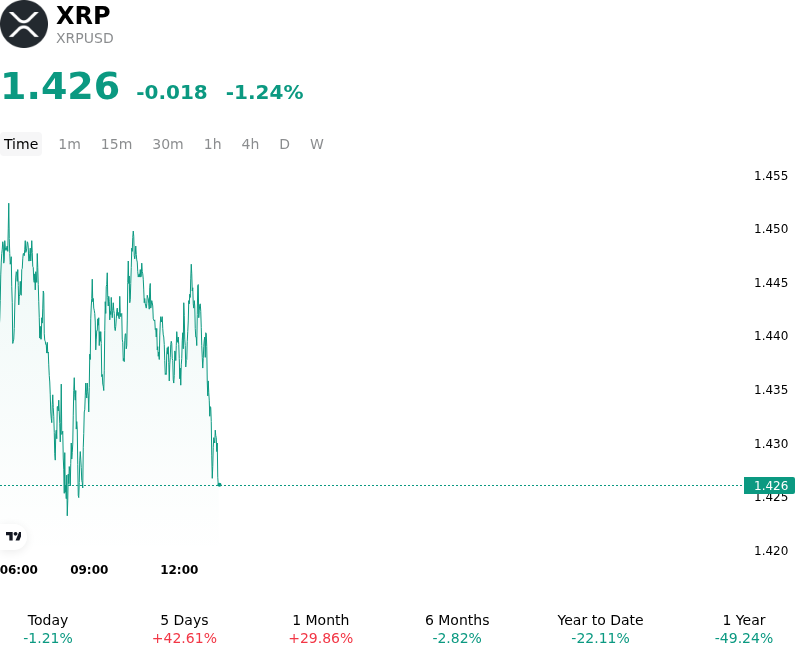
What is driving XRP (XRPUSD)’s stock price down today?
The pullback in XRP reflects a period of market consolidation and profit-taking following a powerful multi-day surge that carried the token into heavy overhead resistance. After accelerating higher on renewed institutional spot ETF inflows, whale accumulation, and improving broader crypto market momentum, buyer exhaustion set in around critical supply zones. Short-term market participants locked in gains, leading to a temporary slowdown in spot buying pressure and a gentle unwind of overleveraged long derivatives positioning across major derivatives exchanges.
Macroeconomic conditions and cross-market dynamics also contributed to the softer trading tone. A pause in Bitcoin's upward trajectory prompted a broader cooling across altcoins, as capital temporarily rotated back into lower-beta digital assets. While U.S. spot XRP ETFs continue to demonstrate resilient cumulative inflows and long-term institutional interest, short-term spot order books experienced liquidity thinning. This allowed profit-taking flows to temporarily outweigh net institutional demand during the trading session.
From a structural and regulatory perspective, the asset continues to digest recent policy updates, including the publication of proposed regulatory frameworks by the U.S. Securities and Exchange Commission and ongoing legislative debates surrounding digital asset market structure. Additionally, predictable token unlock schedules and routine monthly escrow releases require sustained secondary market capital inflows to maintain strong upward momentum. As institutional participants await clearer macroeconomic guidance on monetary policy and broader systemic liquidity, XRP appears to be entering a healthy digestion phase, balancing structural long-term allocation against short-term speculative positioning.
Technical Analysis of XRP (XRPUSD)
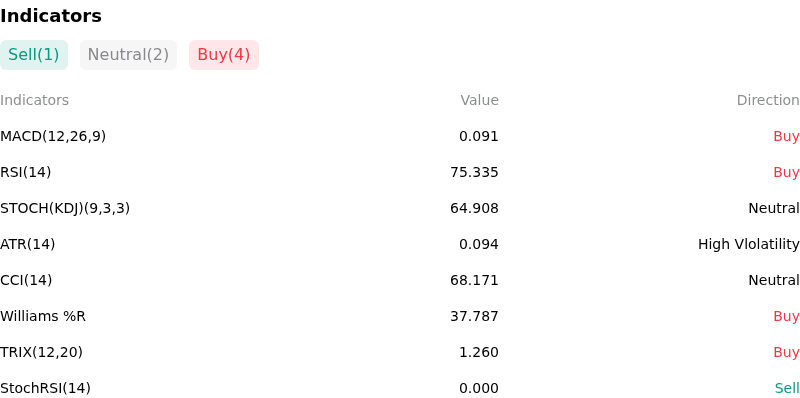
Technically, XRP (XRPUSD) shows a MACD (12,26,9) value of 0.091, indicating a buy signal. The RSI at 75.335 suggests buy condition and the Williams %R at 37.787 suggests buy condition. Please monitor closely.
More details about XRP (XRPUSD)
Recent Events and Risks:
- Derivatives Deleveraging and Long Liquidation Wave: A violent deleveraging event flushed out approximately $500 million in XRP leveraged long positions during a sharp price collapse from its peak near $1.70 down to the $1.46–$1.50 range, leaving derivatives markets highly sensitive to further long squeeze cascades.
- Technical Resistance Rejection and Momentum Decay: XRP faced strong sell-side rejection at the $1.55–$1.70 overhead resistance zone, resulting in an intraday pullback below $1.50, a bearish MACD crossover on lower timeframes, and downside vulnerability toward key support between $1.35 and $1.43.
- Whale Exchange Transfers and Distribution Concerns: On-chain monitoring tracked significant XRP transfers into major exchange wallets, including a reported $175 million exchange deposit by a Ripple co-founder, triggering market fears of institutional profit-taking and elevated spot selling pressure.
- Altcoin Liquidity Drain and Bitcoin Dominance Pressure: Broader crypto market retracements and elevated Bitcoin market dominance have concentrated trading volume away from altcoins, reducing spot liquidity for XRP and amplifying intraday price volatility during risk-off shifts.
Nothing in this material constitutes investment advice, personal recommendation, investment research, an offer, or a solicitation to buy or sell any financial instrument. The content has been prepared without consideration of your individual investment objectives, financial situation, or needs, and should not be treated as such.
Past performance is not a reliable indicator of future performance and/or results. Forward-looking scenarios or forecasts are not a guarantee of future performance. Actual results may differ materially from those anticipated.
Mitrade makes no representation or warranty as to the accuracy or completeness of the information provided and accepts no liability for any loss arising from reliance on such information.
Recommended Articles


