



Synopsys Inc Stock (SNPS) Closed Down by 5.63% on Sep 1: A Full Analysis
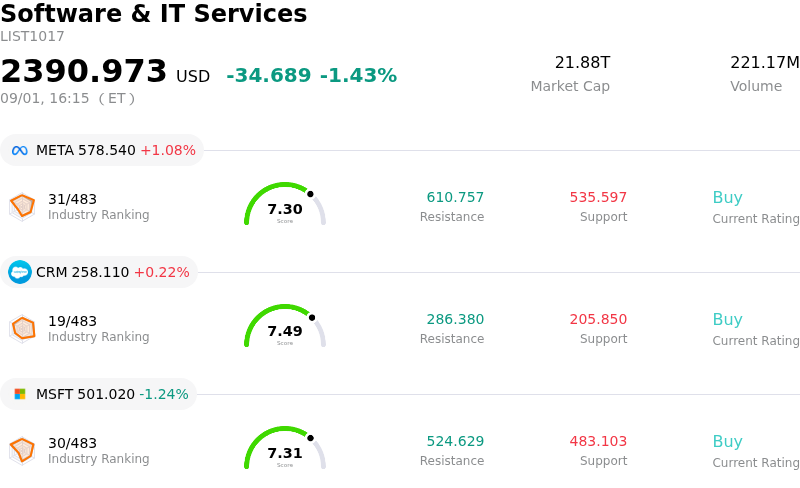
Synopsys Inc (SNPS) closed down by 5.63%. The Software & IT Services sector is down by 1.43%. The company underperformed the industry. Top 3 stocks by turnover in the sector: Meta Platforms Inc (META) up 1.08%; Salesforce Inc (CRM) up 0.22%; Microsoft Corp (MSFT) down 1.24%.
What is driving Synopsys Inc (SNPS)’s stock price down today?
Synopsys experienced notable downward movement as insider transaction disclosures triggered short-term profit-taking across the market. The pressure was primarily sparked by an SEC filing indicating that Executive Chairman Aart de Geus sold a portion of his direct holdings under a pre-arranged Rule 10b5-1 trading plan. Given that the stock had staged a meaningful rally over previous weeks, the news prompted investors to lock in recent gains, contributing to heightened intraday volatility.
The decline comes despite a solid fundamental backdrop established by the company's recent third-quarter earnings report. Synopsys posted strong revenue and earnings that topped consensus estimates, supported by robust demand for electronic design automation software and accelerated momentum from its Ansys integration. Furthermore, management raised full-year top-line and earnings guidance, citing accelerating artificial intelligence adoption across silicon and system design. However, market sentiment was dampened by broader macroeconomic factors, including higher benchmark bond yields that disproportionately pressure high-valuation technology and growth names.
From an institutional standpoint, investors are weighing Synopsys' strong strategic positioning against integration execution and financial leverage. While the addition of Ansys expands the company's addressable market into multiphysics simulation and strengthens its position in physical AI, the significant debt burden from the acquisition remains a focal point for risk-conscious portfolios. The current pullback reflects a market reassessment of short-term valuation multiples rather than a deterioration in core operational performance. Looking ahead, institutional market participants are closely monitoring debt repayment timelines and synergy realization leading up to upcoming corporate strategy presentations.
Technical Analysis of Synopsys Inc (SNPS)
Technically, Synopsys Inc (SNPS) shows a MACD (12,26,9) value of 7.472, indicating a buy signal. The RSI at 49.793 suggests neutral condition and the Williams %R at 65.253 suggests sell condition. Please monitor closely.
Media Coverage of Synopsys Inc (SNPS)
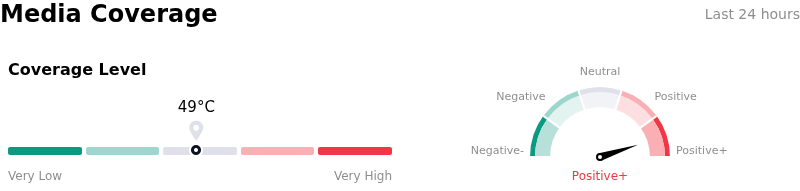
In terms of media coverage, Synopsys Inc (SNPS) shows a coverage score of 49, indicating a moderate level of media attention. The overall market sentiment index is currently in extremely bullish zone.
Fundamental Analysis of Synopsys Inc (SNPS)
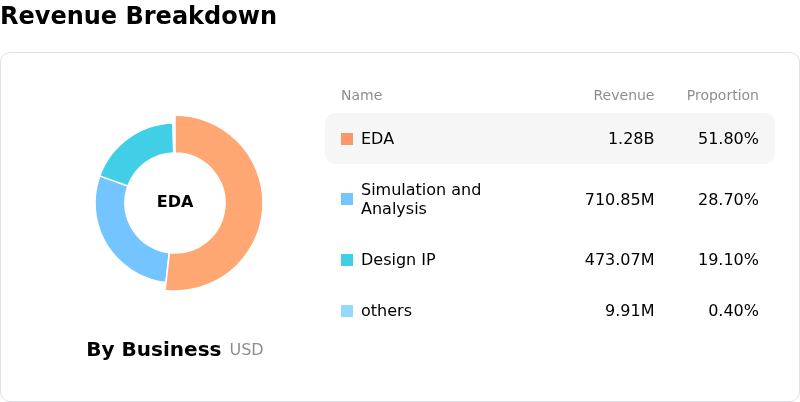
Synopsys Inc (SNPS) is in the Software & IT Services industry. Its latest annual revenue is $7.05B, ranking 46 in the industry. The net profit is $1.33B, ranking 39 in the industry. Company Profile
Over the past month, multiple analysts have rated the company as Buy, with an average price target of $545.02, a high of $633.00, and a low of $414.77.
More details about Synopsys Inc (SNPS)
Company Specific Risks:
- Restructuring and Integration Margin Pressures: Recent fiscal quarterly results revealed substantial restructuring and integration charges following the 35 billion dollar acquisition of Ansys, overshadowing top-line performance and raising institutional concern over near-term GAAP profitability.
- Heavy Executive Insider Selling: Significant share dumping by co-founder Aart de Geus following the earnings announcement has amplified market anxiety, driving sell-the-news sentiment and downward pressure on the stock price.
- Elevated Debt Load and GAAP Disconnect: Carrying approximately 10 billion dollars in debt post-acquisitions, the company also faces scrutiny over a wide gap between non-GAAP EPS guidance and GAAP EPS due to high stock-based compensation costs.
- Muted Backlog Growth and Valuation Compression: Bank of America analysts noted limited backlog support entering the upcoming Investor Day, leaving the stock vulnerable to multiple compression as lofty valuation multiples collide with modest organic growth guidance.
Nothing in this material constitutes investment advice, personal recommendation, investment research, an offer, or a solicitation to buy or sell any financial instrument. The content has been prepared without consideration of your individual investment objectives, financial situation, or needs, and should not be treated as such.
Past performance is not a reliable indicator of future performance and/or results. Forward-looking scenarios or forecasts are not a guarantee of future performance. Actual results may differ materially from those anticipated.
Mitrade makes no representation or warranty as to the accuracy or completeness of the information provided and accepts no liability for any loss arising from reliance on such information.
Recommended Articles


