



NZD/USD (NZDUSD) Is down 0.59% on Sep 1: Are Market Expectations Adjusting?
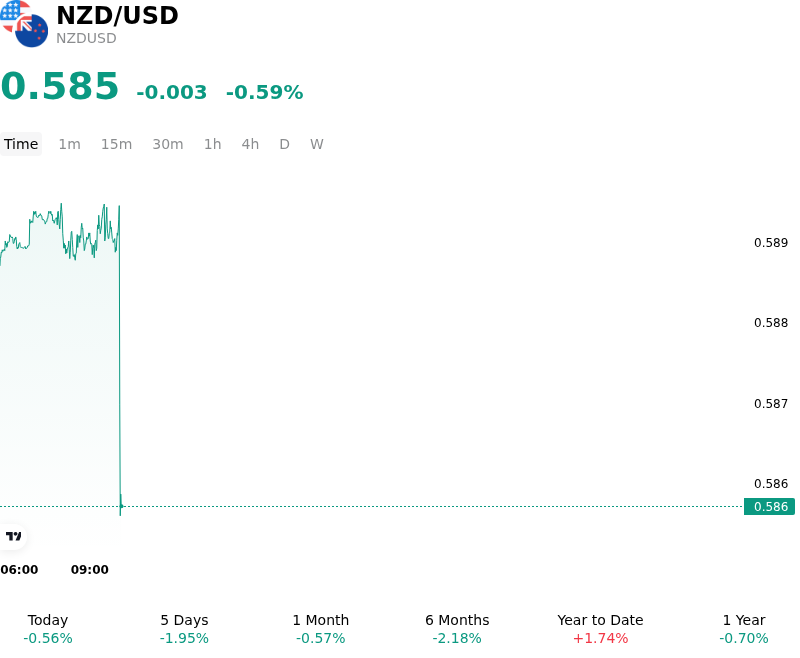
NZD/USD (NZDUSD) is down 0.59% at Sep 1 22:05(ET), now at $0.58535, with a 7-day down of 1.46%.
What is driving NZD/USD (NZDUSD)’s stock price down today?
The decline in NZDUSD was predominantly driven by positioning adjustments and soft domestic fundamentals ahead of the Reserve Bank of New Zealand monetary policy decision. Although markets had largely priced in a twenty-five basis point rate hike, sentiment around the Kiwi turned defensive as investors grew concerned that the central bank would deliver a dovish outcome. Downside risks were highlighted by a weakening labor market with unemployment rising to multi-year highs, sluggish retail volumes, and declining inflation expectations. Consequently, institutional market participants trimmed long Kiwi positions on expectations that the central bank’s updated cash rate projections would struggle to validate aggressive market pricing for further tightening.
On the quote side, the US Dollar maintained a firm stance across major currency pairs, supported by elevated US Treasury yields and lingering hawkish expectations following recent Federal Reserve communications. While US manufacturing PMI and labor market releases showed some cooling, persistent inflationary pressures within input price components reinforced the narrative that the Fed will keep policy rates restrictive. Additionally, heightened geopolitical tensions in the Middle East provided safe-haven support for the Greenback and pushed crude oil prices higher, further weighing on growth-sensitive currencies such as the New Zealand Dollar.
Technical selling amplified the downward movement as the exchange rate breached key short-term trendline support. The breakdown beneath minor moving averages triggered systematic stop-loss orders, extending the pair's decline. Overall, the intraday weakness reflects a combination of pre-event hedging against potential dovish guidance from the Reserve Bank of New Zealand and broader US Dollar resilience supported by yield differentials and geopolitical risk aversion.
Technical Analysis of NZD/USD (NZDUSD)
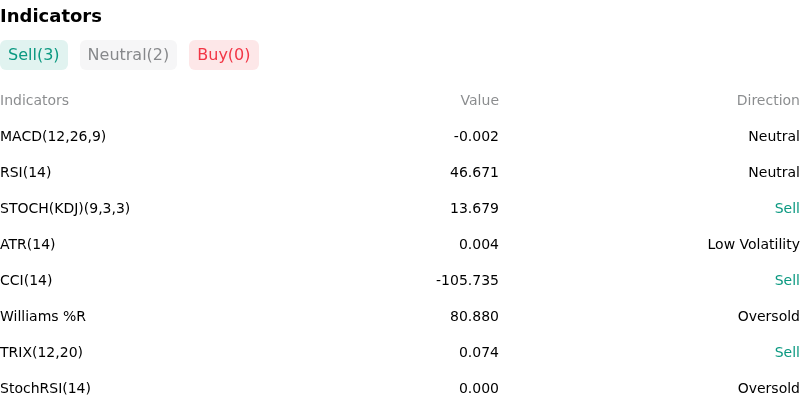
Technically, NZD/USD (NZDUSD) shows a MACD (12,26,9) value of -0.002, indicating a neutral signal. The RSI at 46.671 suggests neutral condition and the Williams %R at 80.880 suggests oversold condition. Please monitor closely.
More details about NZD/USD (NZDUSD)
Recent Events and Risks:
- RBNZ Dovish Disappointment Risk: With a 25 basis point rate hike to 2.75% already fully priced by money markets, the Reserve Bank of New Zealand faces an exceptionally high bar to validate aggressive market expectations of further tightening. Any cautious forward guidance or downward revisions in long-term Official Cash Rate projections leave NZD/USD vulnerable to a sharp dovish repricing.
- Softer Domestic Macro Indicators: Recent New Zealand economic data, including a sharp drop in two-year inflation expectations and an unexpected rise in the unemployment rate to 5.6%, challenge the necessity for extended policy tightening and threaten to drag on front-end Kiwi yield support.
- Hawkish Federal Reserve Expectations: Broad-based US dollar strength, underpinned by firm US Treasury yields and hawkish Fed rate expectations following the Jackson Hole symposium, continues to compress rate differentials against the Kiwi and restrict intraday recovery attempts.
- Technical Support Breakdown and High-Beta Vulnerability: NZD/USD has broken beneath key uptrend support near the 0.5900–0.5920 region and its short-term moving averages, leaving the pair exposed to technical sell-offs and liquidity shocks if global risk sentiment weakens.
Nothing in this material constitutes investment advice, personal recommendation, investment research, an offer, or a solicitation to buy or sell any financial instrument. The content has been prepared without consideration of your individual investment objectives, financial situation, or needs, and should not be treated as such.
Past performance is not a reliable indicator of future performance and/or results. Forward-looking scenarios or forecasts are not a guarantee of future performance. Actual results may differ materially from those anticipated.
Mitrade makes no representation or warranty as to the accuracy or completeness of the information provided and accepts no liability for any loss arising from reliance on such information.
Recommended Articles


