



International Business Machines Corp Stock (IBM) Moved Down by 3.04% on Sep 18: Drivers Behind the Movement
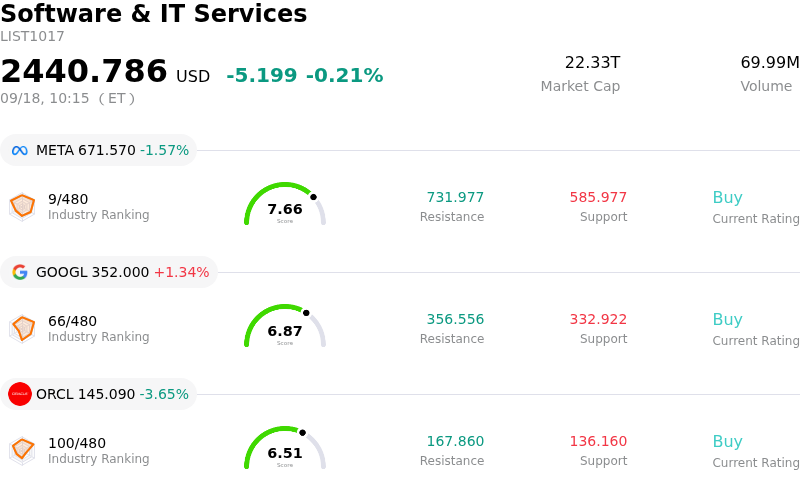
International Business Machines Corp (IBM) moved down by 3.04%. The Software & IT Services sector is down by 0.21%. The company underperformed the industry. Top 3 stocks by turnover in the sector: Meta Platforms Inc (META) down 1.66%; Alphabet Inc Class A (GOOGL) up 1.34%; Oracle Corp (ORCL) down 3.75%.
What is driving International Business Machines Corp (IBM)’s stock price down today?
International Business Machines experienced downward pressure as market participants engaged in profit-taking following a substantial recent run-up in share value. A key sentiment catalyst stems from a classic sell-the-news reaction after the formal finalization of a major federal award under the U.S. CHIPS and Science Act for IBM's quantum wafer foundry subsidiary. Because market participants had already priced in the expected government support following earlier disclosures, the official sign-off prompted short-term traders and institutional investors to lock in profits, leading the stock to underperform relative to the broader technology sector.
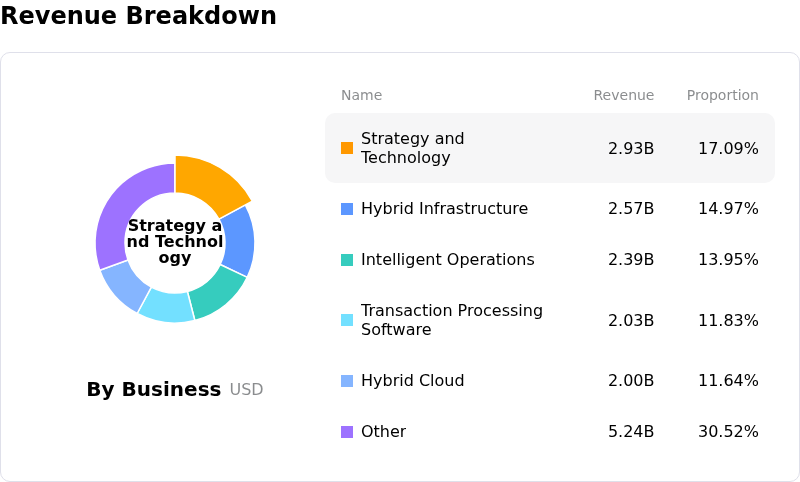
Beyond immediate sentiment-driven profit-taking, underlying fundamental uncertainties surrounding enterprise technology spending continue to weigh on institutional confidence. Investors remain focused on execution timing within IBM's transaction processing and software segments, where contract deferrals and shifted deal timelines previously forced management to temper full-year revenue expectations. As enterprise clients temporarily reallocate IT budgets toward hardware and cloud infrastructure ahead of pricing adjustments, questions remain over whether delayed transactional software licensing deals will fully recover in the second half of the year, creating persistent top-line caution among equity analysts.
While long-term growth initiatives in hybrid cloud, artificial intelligence, and quantum computing provide structural support, near-term capital commitments and broader macroeconomic uncertainty limit immediate upside momentum. The additional capital intensity required for advanced manufacturing ventures, paired with market sensitivity around Federal Reserve policy and interest rate expectations, has kept buyers cautious. Near-term share price performance will likely hinge on incoming quarterly operational data demonstrating sustained recurring software growth and clear signs that enterprise contract execution is back on track.
Technical Analysis of International Business Machines Corp (IBM)
Technically, International Business Machines Corp (IBM) shows a MACD (12,26,9) value of -0.046, indicating a neutral signal. The RSI at 44.631 suggests neutral condition and the Williams %R at 94.717 suggests oversold condition. Please monitor closely.
Media Coverage of International Business Machines Corp (IBM)
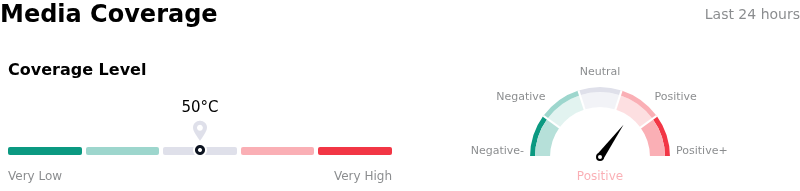
In terms of media coverage, International Business Machines Corp (IBM) shows a coverage score of 50, indicating a moderate level of media attention. The overall market sentiment index is currently in bullish zone.
Fundamental Analysis of International Business Machines Corp (IBM)
International Business Machines Corp (IBM) is in the Software & IT Services industry. Its latest annual revenue is $67.53B, ranking 7 in the industry. The net profit is $10.59B, ranking 11 in the industry. Company Profile
Over the past month, multiple analysts have rated the company as Buy, with an average price target of $242.71, a high of $350.00, and a low of $174.00.
More details about International Business Machines Corp (IBM)
Company Specific Risks:
- Capital Allocation and Quantum Foundry Execution: Recent disclosures regarding IBM's $1 billion matching capital commitment for the Anderon quantum wafer foundry—part of a broader $10 billion five-year quantum program—have heightened analyst concerns over heavy capital outlays and operational execution risks while core segments face macro drag.
- Transactional Software Contract Slippage: Institutional analysis from the past 72 hours highlights persistent vulnerability in IBM's non-recurring transactional software division, as key enterprise clients defer large mainframe license agreements to prioritize supply-constrained hardware infrastructure.
- Consulting Segment and IT Spending Vulnerability: Market commentary over the last 48 hours underscores ongoing revenue drag across IBM's Consulting division, where enterprise IT budget tightening and cautious corporate spending continue to slow discretionary project sign-offs and contract conversions.
- Asymmetric Downside Volatility and Guidance Pressure: Recent market performance data shows IBM exhibiting elevated downside capture during market sell-offs, reflecting persistent institutional skepticism following management's reduction of full-year constant-currency revenue growth guidance to 4%–5%.
Nothing in this material constitutes investment advice, personal recommendation, investment research, an offer, or a solicitation to buy or sell any financial instrument. The content has been prepared without consideration of your individual investment objectives, financial situation, or needs, and should not be treated as such.
Past performance is not a reliable indicator of future performance and/or results. Forward-looking scenarios or forecasts are not a guarantee of future performance. Actual results may differ materially from those anticipated.
Mitrade makes no representation or warranty as to the accuracy or completeness of the information provided and accepts no liability for any loss arising from reliance on such information.
Recommended Articles


