



Brent (UKOIL) Is down 2.04% on Sep 21: What Is Driving the Move?
Brent (UKOIL) is down 2.04% at Sep 21 21:20(ET), now at $97.9, with a 7-day down of 5.99%.
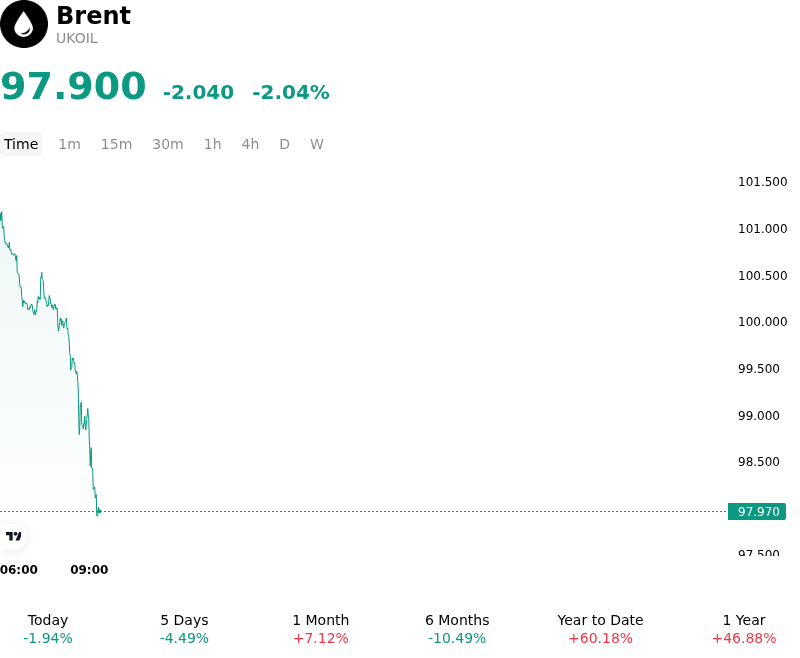
What is driving Brent (UKOIL)’s stock price down today?
The downward pressure on Brent crude oil reflects a combination of technical profit-taking and easing immediate supply risk premiums after prices recently reached multi-month highs. The primary catalyst behind the pullback is market speculation regarding a potential near-term recovery in Middle Eastern crude transit capabilities. Reports indicating that key Saudi export infrastructure, notably the East-West pipeline, could resume throughput following temporary suspensions helped alleviate fears of prolonged supply chokepoints. As market participants recalibrated the probability of immediate severe trade disruptions, the geopolitical risk premium that had propelled crude to recent highs began to unwind.
On the macroeconomic front, elevated energy prices in preceding sessions raised concerns over persistent inflationary pressures, stoking expectations of prolonged restrictive monetary policy by major central banks. The prospect of sustained higher interest rates continues to weigh on global economic growth projections and long-term energy demand expectations, particularly across major industrial hubs. Additionally, physical crude buyers demonstrated heightened price sensitivity at triple-digit levels, leading to a temporary pause in spot market accumulation and encouraging institutional capital flows to rebalance exposure.
From a market structure perspective, the price decline coincided with crude testing a critical technical confluence zone around major resistance levels and overbought momentum indicators. This technical wall prompted systematic funds and institutional trading desks to lock in profits following a rapid multi-week rally. While structural supply constraints and lean global commercial inventory levels continue to provide a floor for benchmark crude, the intraday move represents an event-driven repricing as traders balance headline-driven supply developments against broader macroeconomic demand headwinds.
Technical Analysis of Brent (UKOIL)
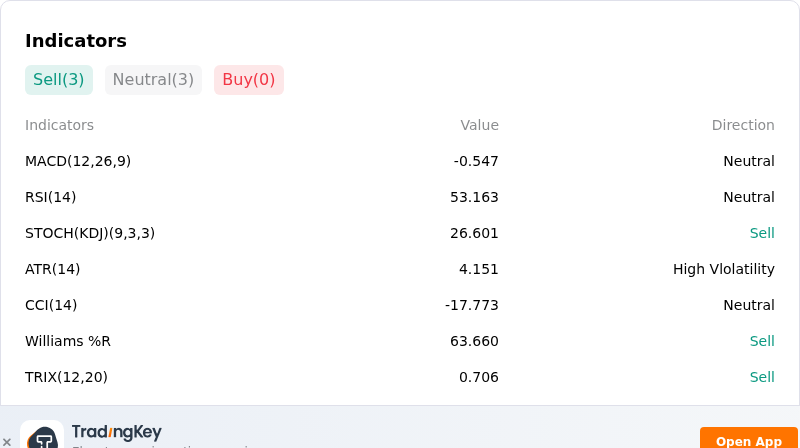
Technically, Brent (UKOIL) shows a MACD (12,26,9) value of -0.501, indicating a neutral signal. The RSI at 53.782 suggests neutral condition and the Williams %R at 61.324 suggests sell condition. Please monitor closely.
More details about Brent (UKOIL)
Recent Events and Risks:
- IEA and OPEC Global Demand Downgrades: The International Energy Agency (IEA) warned of a sharp contraction in global oil demand growth driven by high energy costs and economic drag, while OPEC revised down its 2026 demand growth forecast for a fifth consecutive month, intensifying market fears over structural consumption weakness.
- Underwhelming US Inventory Draws and Product Builds: Weekly EIA data revealed a U.S. crude inventory draw of just 0.64 million barrels—substantially below market expectations of 1.6 million barrels—alongside unexpected builds in gasoline and distillate stockpiles, highlighting weak domestic fuel demand and caping intraday rallies.
- Record Americas and Non-OPEC Output Expansion: Surging non-OPEC supply, led by U.S. crude production rising to record levels near 13.95 million barrels per day, is increasing Atlantic Basin availability and creating oversupply risks if global refinery intake falters.
- Diplomatic Talks and Geopolitical Premium Unwind: Recent reports of diplomatic discussions between regional officials in Oman regarding temporary maritime shipping arrangements in the Strait of Hormuz triggered prompt risk-premium unwinding, sparking intraday long liquidation in Brent crude.
Nothing in this material constitutes investment advice, personal recommendation, investment research, an offer, or a solicitation to buy or sell any financial instrument. The content has been prepared without consideration of your individual investment objectives, financial situation, or needs, and should not be treated as such.
Past performance is not a reliable indicator of future performance and/or results. Forward-looking scenarios or forecasts are not a guarantee of future performance. Actual results may differ materially from those anticipated.
Mitrade makes no representation or warranty as to the accuracy or completeness of the information provided and accepts no liability for any loss arising from reliance on such information.
Recommended Articles


