



Newmont Corporation Stock (NEM) Closed Up by 3.42% on Sep 22: Key Drivers Unveiled
Newmont Corporation (NEM) closed up by 3.42%. The Mineral Resources sector is up by 2.15%. The company outperformed the industry. Top 3 stocks by turnover in the sector: Freeport-McMoRan Inc (FCX) up 3.03%; Newmont Corporation (NEM) up 3.42%; CRH PLC (CRH) up 1.03%.
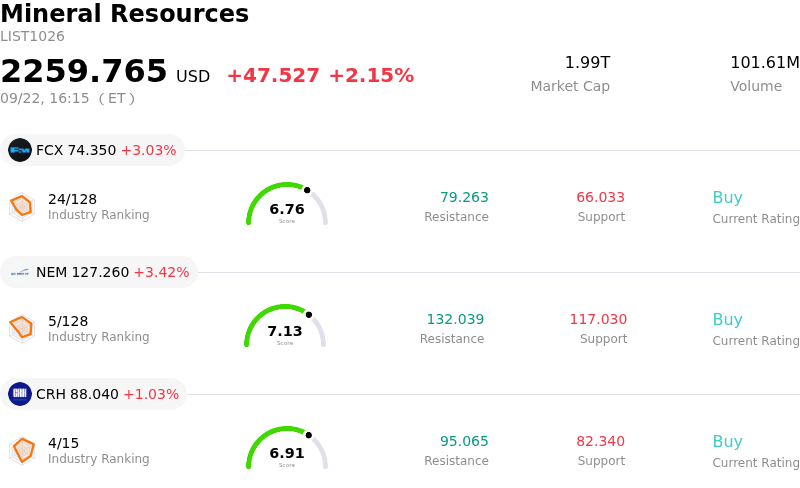
What is driving Newmont Corporation (NEM)’s stock price up today?
The upward momentum in Newmont Corporation share price during intraday trading reflects a confluence of macroeconomic factors, precious metal commodity price recoveries, and positive institutional sentiment. Following the Federal Reserve's policy decision and subsequent interest rate commentary, gold spot prices experienced notable intraday volatility before embarking on a sharp rebound. Market participants quickly digested the central bank's rate trajectory, recognizing that monetary tightening risks were largely factored into precious metal valuations. As physical gold prices stabilized and moved higher, investor appetite returned strongly to senior gold producers, positioning Newmont as a primary beneficiary of the sector-wide commodity rally.
Adding further support to shareholder confidence, recent institutional position updates highlighted sustained demand from major asset managers expanding their stakes in Newmont. The company's solid operational foundation—underpinned by robust quarterly free cash flow, an aggressive ongoing share repurchase program, and disciplined capital management—continues to reassure long-term institutional investors. Management's commitment to returning capital to shareholders through regular dividends and share buybacks further strengthens the company's defensive appeal during periods of heightened market volatility.
From an industry perspective, Newmont remains well-positioned to leverage favorable long-term supply and demand dynamics in the gold mining sector. Structural drivers, including persistent global central bank gold purchasing and ongoing macroeconomic uncertainty, provide a supportive floor for real gold prices and mining operating margins. While interest rate shifts and currency fluctuations may induce short-term price swings, Newmont's high-grade production baseline, cost containment initiatives, and strong net cash position reinforce its attractive earnings profile, driving positive investor sentiment and renewed buying interest across equity markets.
Technical Analysis of Newmont Corporation (NEM)
Technically, Newmont Corporation (NEM) shows a MACD (12,26,9) value of -2.288, indicating a neutral signal. The RSI at 57.367 suggests neutral condition and the Williams %R at 32.213 suggests buy condition. Please monitor closely.
Fundamental Analysis of Newmont Corporation (NEM)
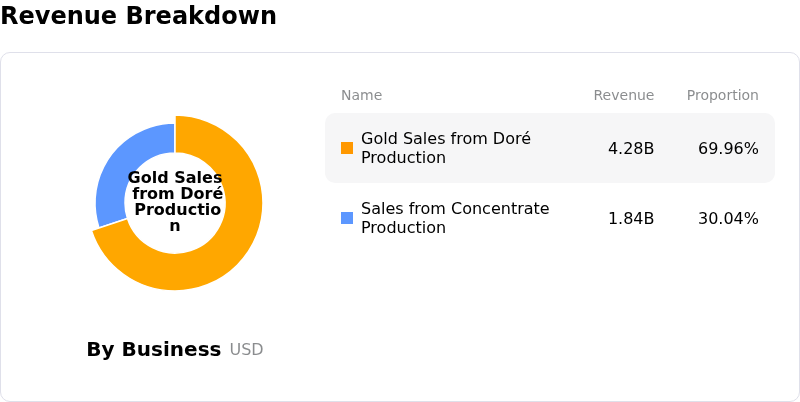
Newmont Corporation (NEM) is in the Mineral Resources industry. Its latest annual revenue is $22.67B, ranking 10 in the industry. The net profit is $7.08B, ranking 3 in the industry. Company Profile
Over the past month, multiple analysts have rated the company as Buy, with an average price target of $139.53, a high of $205.00, and a low of $79.00.
More details about Newmont Corporation (NEM)
Company Specific Risks:
- Macro Gold Price Volatility and Rate Pressures: Recent monetary policy tightening and elevated bond yields have exerted downward pressure on spot gold prices, creating immediate headwind risks for Newmont's primary revenue driver.
- Operational Output Contraction and Mine Grade Headwinds: Lower-grade ore processing and operational challenges across core mining assets have driven volume declines, raising institutional concerns over production guidance stability.
- Escalating Sustaining Costs and High Capital Spending: Rising All-In Sustaining Costs (AISC) alongside heavy capital expenditure requirements for long-term expansion projects threaten to compress profit margins and limit near-term free cash flow generation.
- Valuation Premium and Analyst Price Target Cuts: Trading at a Forward PEG ratio of 1.73—well above the gold mining industry average of 0.94—leaves the stock exposed to valuation contraction following recent target price reductions from major brokerages.
Nothing in this material constitutes investment advice, personal recommendation, investment research, an offer, or a solicitation to buy or sell any financial instrument. The content has been prepared without consideration of your individual investment objectives, financial situation, or needs, and should not be treated as such.
Past performance is not a reliable indicator of future performance and/or results. Forward-looking scenarios or forecasts are not a guarantee of future performance. Actual results may differ materially from those anticipated.
Mitrade makes no representation or warranty as to the accuracy or completeness of the information provided and accepts no liability for any loss arising from reliance on such information.
Recommended Articles


