



Freeport-McMoRan Inc Stock (FCX) Moved Down by 3.44% on Sep 23: What Signal Does It Send?
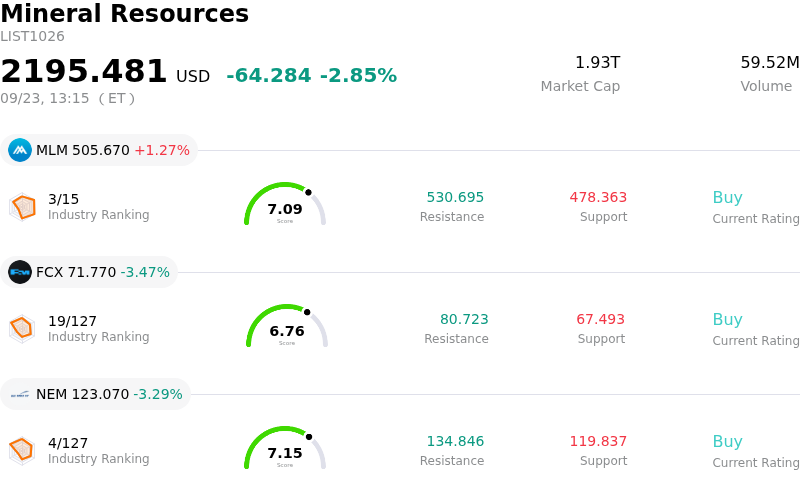
Freeport-McMoRan Inc (FCX) moved down by 3.44%. The Mineral Resources sector is down by 2.85%. The company underperformed the industry. Top 3 stocks by turnover in the sector: Martin Marietta Materials Inc (MLM) up 1.27%; Freeport-McMoRan Inc (FCX) down 3.47%; Newmont Corporation (NEM) down 3.29%.
What is driving Freeport-McMoRan Inc (FCX)’s stock price down today?
Downward pressure on Freeport-McMoRan shares was primarily driven by short-term profit-taking and consolidation across global copper markets following recent multi-session gains. As benchmark copper futures on COMEX and the London Metal Exchange experienced heightened intraday volatility and minor retreats from near-record territory, major copper equities faced sector-wide selling pressure due to their tight pricing correlation with physical metals.
From a corporate and operational standpoint, Freeport-McMoRan maintains high earnings sensitivity to underlying commodity movements, making its valuation particularly responsive to short-term pullbacks in copper futures. Although the company announced its latest quarterly cash dividend incorporating both base and performance-based variable payouts, investor focus remained centered on cost discipline. Persistently elevated unit net cash costs stemming from energy, labor, and chemical inputs, combined with the ongoing ramp-up process at the Grasberg underground complex, served to limit buying enthusiasm on the day.
Institutional positioning also reflected a cautious stance as market participants evaluated broader macroeconomic crosscurrents, including central bank policy outlooks and geopolitical tariff developments affecting international metal flows. While strategic catalysts such as low-cost leaching technology initiatives and long-term structural demand from grid expansion provide a solid fundamental backdrop, near-term share price action will remain strongly tied to commodity market stability and steady execution at core operational sites.
Technical Analysis of Freeport-McMoRan Inc (FCX)
Technically, Freeport-McMoRan Inc (FCX) shows a MACD (12,26,9) value of -0.661, indicating a neutral signal. The RSI at 50.300 suggests neutral condition and the Williams %R at 59.071 suggests sell condition. Please monitor closely.
Media Coverage of Freeport-McMoRan Inc (FCX)
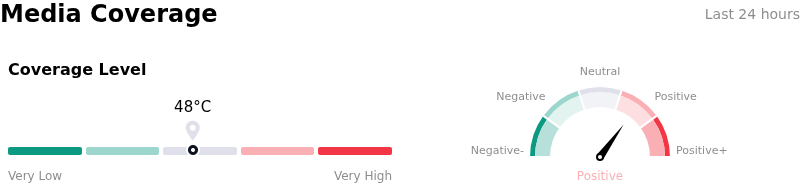
In terms of media coverage, Freeport-McMoRan Inc (FCX) shows a coverage score of 48, indicating a moderate level of media attention. The overall market sentiment index is currently in bullish zone.
Fundamental Analysis of Freeport-McMoRan Inc (FCX)
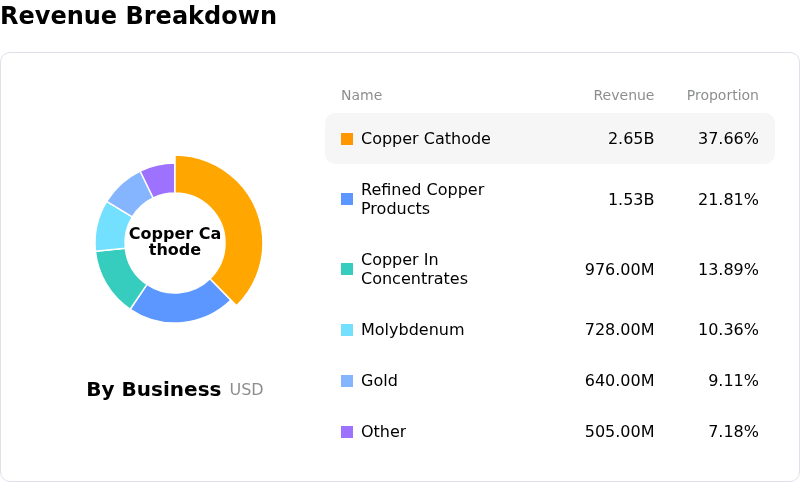
Freeport-McMoRan Inc (FCX) is in the Mineral Resources industry. Its latest annual revenue is $25.91B, ranking 7 in the industry. The net profit is $2.20B, ranking 12 in the industry. Company Profile
Over the past month, multiple analysts have rated the company as Buy, with an average price target of $73.04, a high of $83.00, and a low of $47.00.
More details about Freeport-McMoRan Inc (FCX)
Company Specific Risks:
- U.S. Refined-Copper Tariff Uncertainty: Regulatory ambiguity surrounding delayed White House decisions on proposed refined-copper tariffs has fueled intraday trading volatility, exposing Freeport to downside if skipped tariffs erase expected COMEX pricing premiums across U.S. operations or if enacted tariffs inflate domestic manufacturing costs and trigger demand destruction.
- Grasberg Capacity Bottlenecks and Recovery Delays: Persistent operational constraints at the flagship Grasberg Block Cave underground mine in Indonesia—which continues operating near 65% capacity following ongoing mud-rush remediation—are suppressing short-term copper and gold sales volumes and leaving output target timelines vulnerable to further execution hurdles.
- Asymmetric Cash Flow Exposure to Benchmark Copper Price Swings: High commodity elasticity—where each $0.10 per pound shift in realized copper prices swings annual EBITDA by roughly $390 million—leaves company cash flows and earnings disproportionately exposed to sudden pullbacks in global copper futures and macro currency pressure.
- Escalating Capex and Unit Cash Cost Margin Pressure: Heavy 2026 capital expenditures of $4.3 billion alongside elevated unit net cash costs around $1.90 per pound—driven by sticky input expenses for labor, power, and sulfuric acid—are eroding profit margins and compressing near-term free cash flow yield to a thin 1.6% to 2.1% range.
Nothing in this material constitutes investment advice, personal recommendation, investment research, an offer, or a solicitation to buy or sell any financial instrument. The content has been prepared without consideration of your individual investment objectives, financial situation, or needs, and should not be treated as such.
Past performance is not a reliable indicator of future performance and/or results. Forward-looking scenarios or forecasts are not a guarantee of future performance. Actual results may differ materially from those anticipated.
Mitrade makes no representation or warranty as to the accuracy or completeness of the information provided and accepts no liability for any loss arising from reliance on such information.
Recommended Articles


