

GBP/JPY Price Forecast: Consolidates below 205.50 amid Yen gains
- GBP/JPY dips 0.08% as pair consolidates while Japanese officials warn over rapid currency moves.
- RSI above neutral keeps bullish momentum intact if buyers reclaim the 206.00 resistance zone.
- Break below 204.30 risks deeper correction toward 204.00 and the 50-day SMA near 202.17.
GBP/JPY consolidates during Tuesday’s session as the Japanese Yen (JPY) appreciates on threats of possible intervention of the BoJ in the FX markets, and also as Pound Sterling traders wait for the release of UK’s fiscal budget. At the time of writing, the cross trades at 205.44, losing 0.08%.
GBP/JPY Price Forecast: Technical outlook
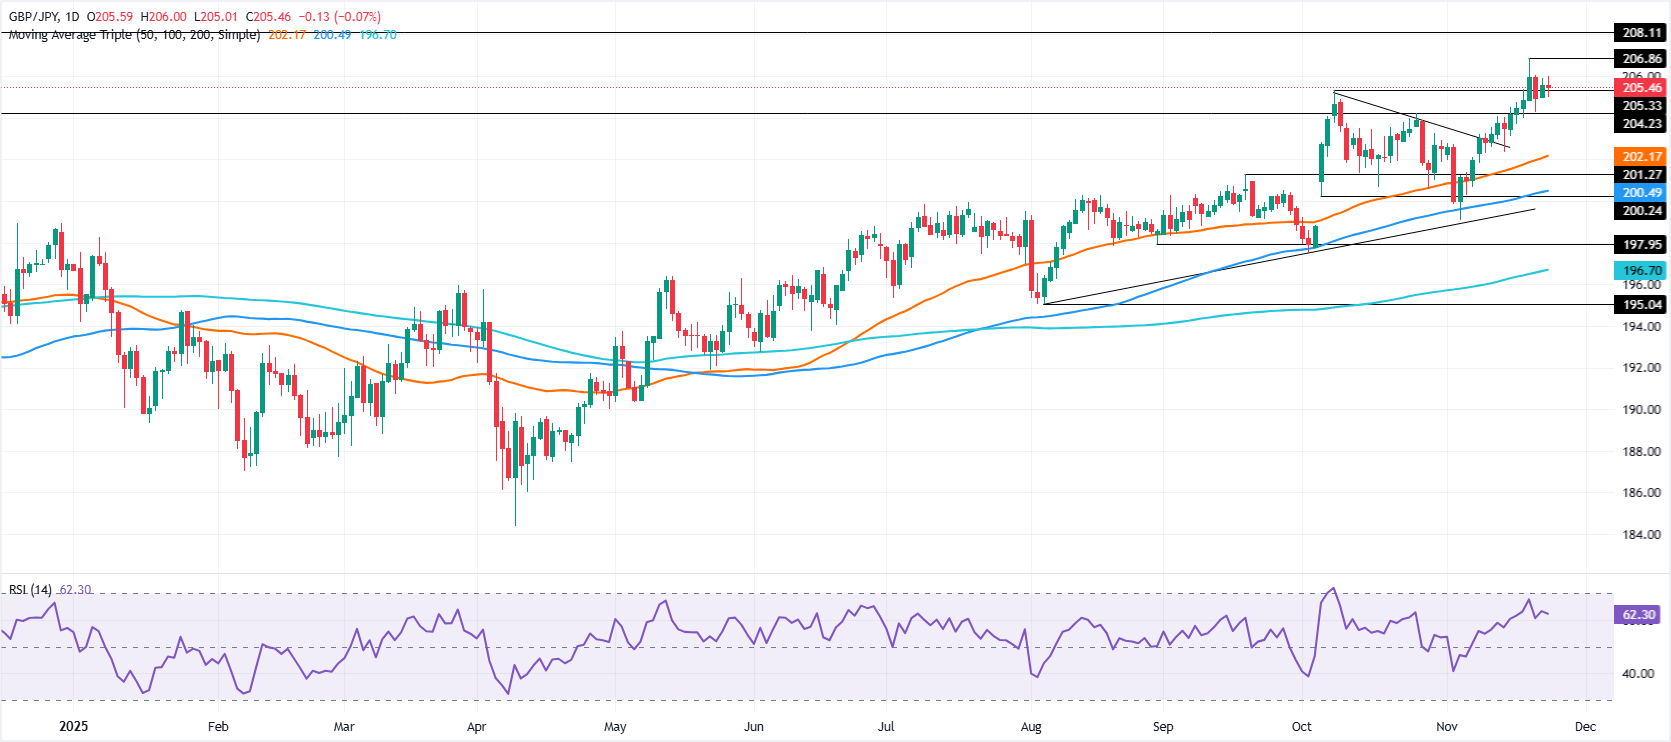
The GBP/JPY trades sideways but a daily close below 206.00 and 205.50, could sponsor a retest of last Friday’s low of 204.30. Momentum favors further upside as the Relative Strength Index (RSI) lies above its neutral line, an indication that buyers outweigh sellers.
That said, if the cross rises past 206.00, the next stop would be the yearly peak of 206.86, ahead of the 207.00 milestone. Once cleared, the next resistance is 208.00 ahead of 210.00.
For a bearish continuation, sellers must clear the November 21 low of 204.30. The next support would be 204.00 and the 50-day SMA at 202.17.
GBP/JPY Price Chart – Daily
Pound Sterling Price This week
The table below shows the percentage change of British Pound (GBP) against listed major currencies this week. British Pound was the strongest against the Canadian Dollar.
| USD | EUR | GBP | JPY | CAD | AUD | NZD | CHF | |
|---|---|---|---|---|---|---|---|---|
| USD | -0.48% | -0.49% | -0.34% | -0.01% | -0.17% | -0.13% | -0.14% | |
| EUR | 0.48% | -0.03% | 0.13% | 0.46% | 0.29% | 0.34% | 0.34% | |
| GBP | 0.49% | 0.03% | 0.14% | 0.49% | 0.31% | 0.37% | 0.35% | |
| JPY | 0.34% | -0.13% | -0.14% | 0.33% | 0.10% | 0.08% | 0.21% | |
| CAD | 0.00% | -0.46% | -0.49% | -0.33% | -0.18% | -0.12% | -0.13% | |
| AUD | 0.17% | -0.29% | -0.31% | -0.10% | 0.18% | 0.07% | 0.06% | |
| NZD | 0.13% | -0.34% | -0.37% | -0.08% | 0.12% | -0.07% | -0.01% | |
| CHF | 0.14% | -0.34% | -0.35% | -0.21% | 0.13% | -0.06% | 0.01% |
The heat map shows percentage changes of major currencies against each other. The base currency is picked from the left column, while the quote currency is picked from the top row. For example, if you pick the British Pound from the left column and move along the horizontal line to the US Dollar, the percentage change displayed in the box will represent GBP (base)/USD (quote).
Nothing in this material constitutes investment advice, personal recommendation, investment research, an offer, or a solicitation to buy or sell any financial instrument. The content has been prepared without consideration of your individual investment objectives, financial situation, or needs, and should not be treated as such.
Past performance is not a reliable indicator of future performance and/or results. Forward-looking scenarios or forecasts are not a guarantee of future performance. Actual results may differ materially from those anticipated.
Mitrade makes no representation or warranty as to the accuracy or completeness of the information provided and accepts no liability for any loss arising from reliance on such information.
Recommended Articles


