

Australian Dollar holds ground following first complete monthly CPI
- The Australian Dollar moves little after the first “complete” monthly Consumer Price Index on Wednesday.
- Australia’s CPI rose 3.8% YoY in October, beating the market forecast of 3.6% and accelerating from the previous 3.5% increase.
- The US Dollar faces challenges as softer data reinforce the likelihood of a Fed rate cut in December.
The Australian Dollar (AUD) advances against the US Dollar (USD) on Wednesday, extending its gains for the fourth successive session. The AUD/USD pair holds ground after the Australian Bureau of Statistics (ABS) released the first “complete” monthly Consumer Price Index (CPI), which climbed by 3.8% year-over-year (YoY) in October. The reading surpassed the market consensus of a 3.6% rise and a 3.5% increase prior.
The AUD could gain ground as the first monthly CPI increased the cautious sentiment surrounding the Reserve Bank of Australia (RBA) policy outlook. The RBA is expected to maintain the Official Cash Rate (OCR) at 3.6% in December as inflation remains above the RBA’s 2–3% target range. RBA officials noted that the unemployment rate has risen slightly, but the job market is still healthy and is expected to remain so.
Minutes from the RBA’s November meeting indicated the central bank may keep rates unchanged for an extended period. ASX 30-Day Interbank Cash Rate Futures show that as of November 25, the December 2025 contract traded at 96.41, implying a 6% probability of a rate cut to 3.35% from 3.60% at the upcoming RBA Board meeting.
US Dollar struggles as recent data increase Fed rate cut bets
- The US Dollar Index (DXY), which measures the value of the US Dollar against six major currencies, is holding ground after registering modest losses in the previous session and trading around 99.80 at the time of writing. The Greenback faced challenges amid rising expectations of a Fed rate cut in December, driven by recent softer US data.
- The CME FedWatch Tool suggests that markets are now pricing in more than 84% odds that the Fed will cut its benchmark overnight borrowing rate by 25 basis points (bps) at its December meeting, up from 50% probability that markets priced a week ago.
- The US Producer Price Index (PPI) remained steady at 2.7% year-over-year in September, matching expectations and August’s reading and suggesting that inflationary pressures have stabilized. Core PPI eased to 2.6% from 2.9%, undershooting forecasts of 2.7%.
- US Retail Sales rose by 0.2% month-over-month (MoM) in September, slowing from the 0.6% increase seen in August, indicating more cautious consumer spending. Separately, the Conference Board reported a sharp deterioration in household sentiment, with Consumer Confidence sliding 6.8 points to 88.7 in November from 95.5 in October.
- Fed Governor Christopher Waller told Fox Business on Monday that his main concern is the weakening labour market, adding that inflation is “not a big problem” given the recent softness in employment. He also said the September payrolls figure will likely be revised lower and warned that concentrated hiring is “not a good sign,” indicating his support for a near-term rate cut.
- New York Fed President John Williams said on Friday that policymakers could still cut rates in the “near-term,” a remark that lifted market odds for a December move. Moreover, Fed Governor Stephen Miran said that Nonfarm Payrolls data supports a December rate cut, adding that if his vote were decisive, he “would vote for a 25-bps cut.”
- The preliminary reading of Australia's S&P Global Manufacturing Purchasing Managers Index (PMI) came in at 51.6 in November, versus 49.7 prior. Meanwhile, Services PMI rose to 52.7 in November from the previous reading of 52.5, while the Composite PMI increased to 52.6 in November versus 52.1 prior.
- The Reserve Bank of Australia published the Minutes of its November monetary policy meeting last week, indicating that board members signalled a more balanced policy stance, adding that it could keep the cash rate unchanged for longer if incoming data proves stronger than expected.
- RBA Assistant Governor Sarah Hunter noted last week that “sustained above-trend growth could fuel inflationary pressures.” Hunter noted that monthly inflation data can be volatile and that the central bank won’t react to a single month of figures. She added that the RBA is closely assessing labor-market conditions to gauge supply capacity and is examining how the effects of monetary policy may be changing over time.
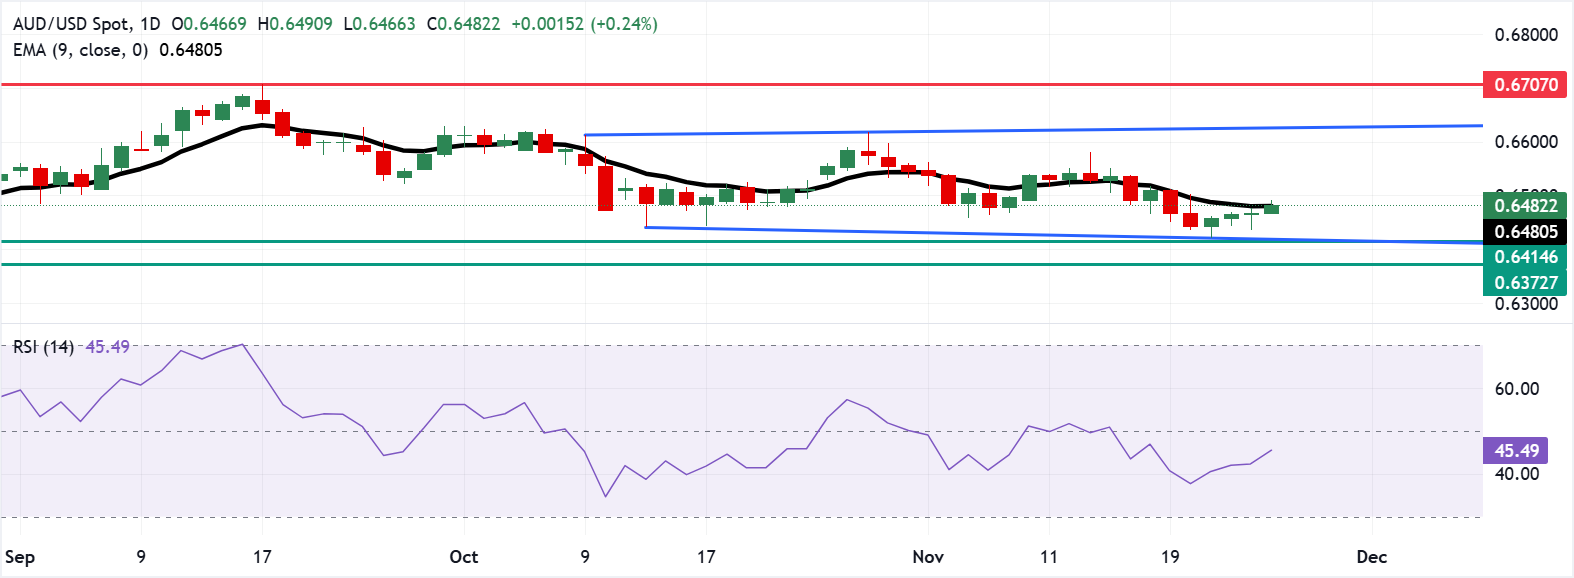
Australian Dollar could target 0.6500 after decisively breaking above nine-day EMA
The AUD/USD pair is trading around 0.6480 on Wednesday. The daily chart analysis shows the pair holding within a rectangular consolidation zone, signaling a neutral bias. The pair continues to trade below the nine-day Exponential Moving Average (EMA), highlighting subdued short-term momentum.
The AUD/USD pair finds immediate support at the lower boundary of the rectangle around 0.6420, followed by the five-month low of 0.6414, which was recorded on August 21.
On the upside, the pair hovers around the nine-day EMA of 0.6479. A successful break above this level would support the AUD/USD pair to test the psychological level of 0.6500. Further advances would lead the pair to reach the rectangle’s upper boundary near 0.6630.
Australian Dollar Price Today
The table below shows the percentage change of Australian Dollar (AUD) against listed major currencies today. Australian Dollar was the strongest against the Japanese Yen.
| USD | EUR | GBP | JPY | CAD | AUD | NZD | CHF | |
|---|---|---|---|---|---|---|---|---|
| USD | -0.02% | -0.05% | 0.14% | -0.06% | -0.22% | -0.90% | 0.01% | |
| EUR | 0.02% | -0.03% | 0.14% | -0.04% | -0.20% | -0.89% | 0.03% | |
| GBP | 0.05% | 0.03% | 0.19% | 0.01% | -0.16% | -0.85% | 0.07% | |
| JPY | -0.14% | -0.14% | -0.19% | -0.19% | -0.35% | -1.03% | -0.12% | |
| CAD | 0.06% | 0.04% | -0.01% | 0.19% | -0.17% | -0.85% | 0.08% | |
| AUD | 0.22% | 0.20% | 0.16% | 0.35% | 0.17% | -0.69% | 0.23% | |
| NZD | 0.90% | 0.89% | 0.85% | 1.03% | 0.85% | 0.69% | 0.93% | |
| CHF | -0.01% | -0.03% | -0.07% | 0.12% | -0.08% | -0.23% | -0.93% |
The heat map shows percentage changes of major currencies against each other. The base currency is picked from the left column, while the quote currency is picked from the top row. For example, if you pick the Australian Dollar from the left column and move along the horizontal line to the US Dollar, the percentage change displayed in the box will represent AUD (base)/USD (quote).
Economic Indicator
Consumer Price Index (YoY)
The Consumer Price Index (CPI), released by the Australian Bureau of Statistics on a monthly basis, measures the changes in the price of a comprehensive basket of goods and services acquired by household consumers. The indicator is the primary measure of headline inflation after a new methodology was applied to transition from quarterly to monthly readings, applying to data from April 2024 onwards. The YoY reading compares prices in the reference month to the same month a year earlier. A high reading is seen as bullish for the Australian Dollar (AUD), while a low reading is seen as bearish.
Read more.Last release: Wed Nov 26, 2025 00:30
Frequency: Monthly
Actual: 3.8%
Consensus: 3.6%
Previous: 3.5%
Source: Australian Bureau of Statistics
Nothing in this material constitutes investment advice, personal recommendation, investment research, an offer, or a solicitation to buy or sell any financial instrument. The content has been prepared without consideration of your individual investment objectives, financial situation, or needs, and should not be treated as such.
Past performance is not a reliable indicator of future performance and/or results. Forward-looking scenarios or forecasts are not a guarantee of future performance. Actual results may differ materially from those anticipated.
Mitrade makes no representation or warranty as to the accuracy or completeness of the information provided and accepts no liability for any loss arising from reliance on such information.
Recommended Articles


