

AUDUSD Price Forecast: Momentum improves as AUDUSD tests the 50- and 100-day SMA cluster
- The Aussie continues to outperform the US Dollar, with AUD/USD hovering near two-week highs as bullish momentum holds firm.
- Technically, AUD/USD is pressing into the top of its descending channel, where the 50-day and 100-day SMAs converge to cap upside attempts.
- Momentum improves as the MACD turns positive and the RSI holds comfortably in the mid-50s.
The Australian Dollar (AUD) remains on the front foot against the US Dollar (USD) on Thursday, as traders lean into expectations that the Reserve Bank of Australia (RBA) will keep policy steady at its December meeting while maintaining a hawkish bias. At the time of writing, AUD/USD is trading around 0.6530, extending gains for the sixth straight day.
Renewed upside momentum comes as markets scale back rate-cut bets after Australia’s latest inflation readings surprised to the upside, reinforcing expectations that the RBA will keep interest rates on hold again after leaving the official cash rate unchanged at 3.60% at its November meeting.
Against this backdrop, the broader weakness in the Greenback is amplifying demand for the Aussie, with traders growing increasingly confident that the Federal Reserve (Fed) will lower interest rates at its December 9-10 meeting.
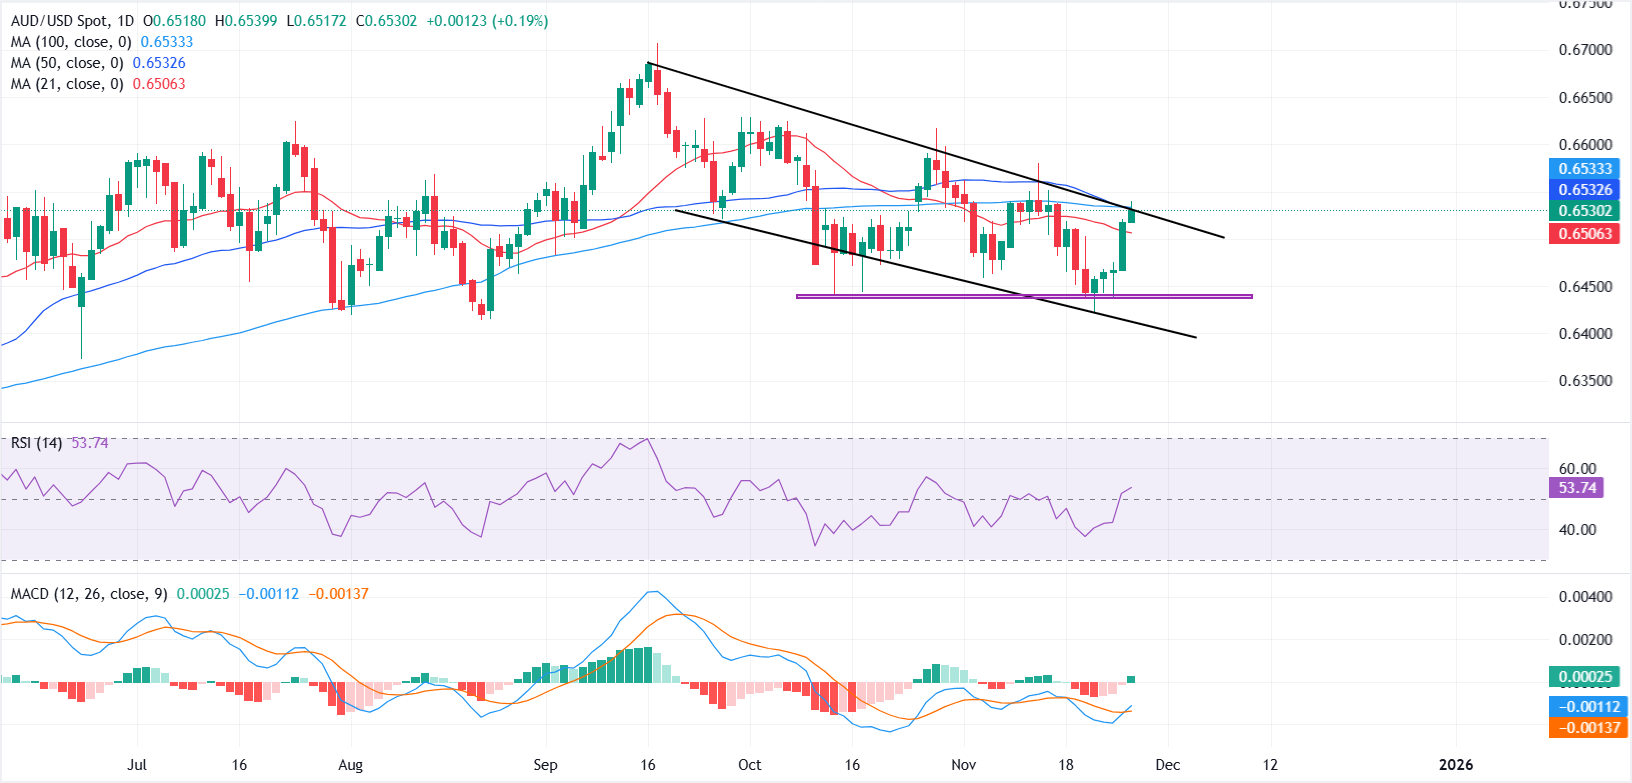
On the daily chart, AUD/USD continues to trade within a well-defined descending channel pattern, with the latest leg higher pressing firmly against the pattern’s upper boundary. This zone has now become a significant technical barrier, reinforced by the confluence of the 50-day and 100-day Simple Moving Averages (SMAs), both of which have repeatedly capped upside attempts throughout November.
A decisive breakout above this cluster would mark a meaningful shift in structure, effectively invalidating the broader bearish channel and opening the door toward the November 13 swing high at 0.6580, followed by the 0.6600 psychological mark.
Momentum indicators are turning increasingly supportive. The Moving Average Convergence Divergence (MACD) shows a bullish crossover near the zero line as the histogram turns positive. The Relative Strength Index (RSI) sits near 53, neutral-to-firm, backing an improving but still cautious momentum backdrop.
On the downside, the 21-day SMA near 0.6506 is positioned as immediate support and could cushion any pullbacks in the short term. A break below this level would expose 0.6450 as the next significant support area, ahead of a potential retest of the channel’s lower boundary.
Nothing in this material constitutes investment advice, personal recommendation, investment research, an offer, or a solicitation to buy or sell any financial instrument. The content has been prepared without consideration of your individual investment objectives, financial situation, or needs, and should not be treated as such.
Past performance is not a reliable indicator of future performance and/or results. Forward-looking scenarios or forecasts are not a guarantee of future performance. Actual results may differ materially from those anticipated.
Mitrade makes no representation or warranty as to the accuracy or completeness of the information provided and accepts no liability for any loss arising from reliance on such information.
Recommended Articles


