

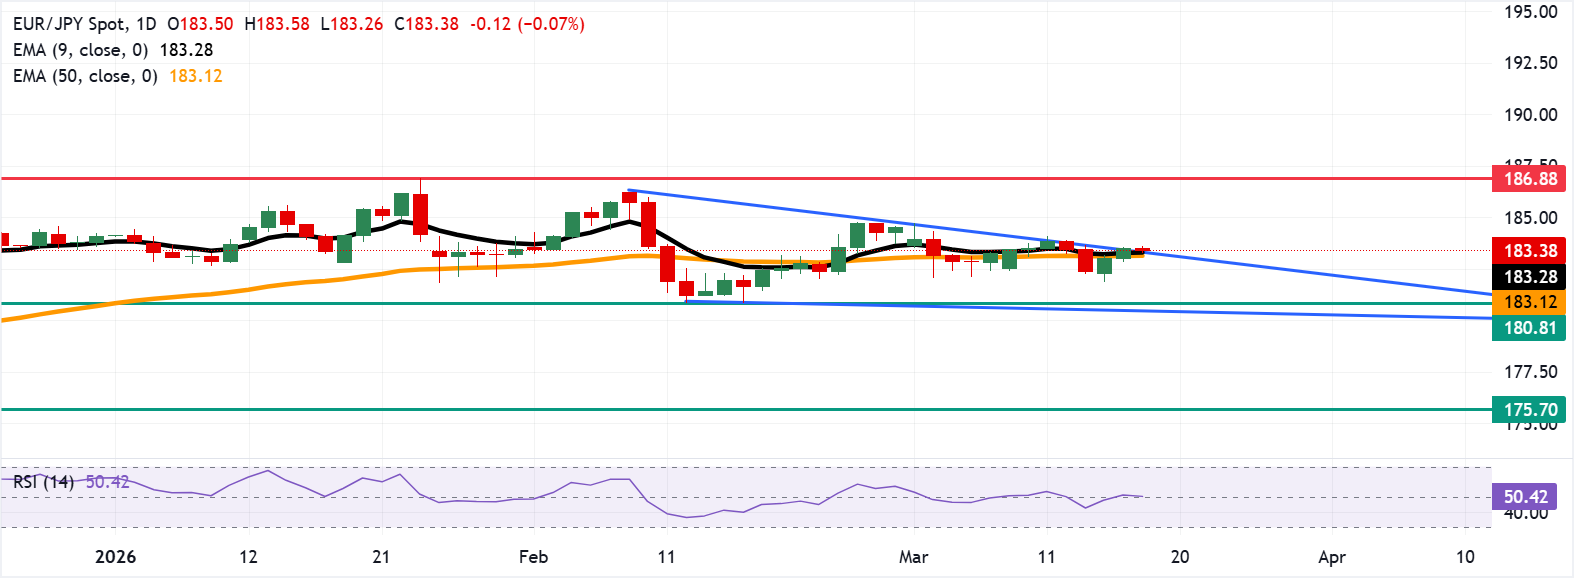
EUR/JPY Price Forecast: Tests upper descending triangle boundary near 183.50
- EUR/JPY tests the immediate barrier around the upper descending triangle boundary at 183.40.
- The 14-day Relative Strength Index near 50 indicates neutral momentum.
- Immediate support lies at the nine-day EMA at 183.28.
EUR/JPY depreciates after registering gains in the previous two sessions, trading around 183.40 during the Asian hours on Wednesday. The technical analysis of the daily chart shows the spot testing the upper boundary of a descending triangle, suggesting potential resistance and a possible continuation of the bearish trend unless a breakout occurs.
However, the near-term bias is mildly bullish as the EUR/JPY cross holds above the 50-day EMA and the nine-day EMA, signaling an ongoing uptrend rather than a reversal. The 14-day Relative Strength Index (RSI) around 50 underscores balanced momentum, with neither overbought nor oversold conditions, which keeps the focus on price action around the clustered moving averages to judge whether buyers can regain control.
A successful breakout above the descending triangle would indicate bullish confirmation and may support the EUR/JPY cross to explore the region around the all-time high of 186.88, reached on January 23.
On the downside, immediate support is seen at the nine-day EMA of 183.28, followed by the 50-day EMA of 183.12. Further declines below the short- and medium-term averages would revive the bearish bias and put downward pressure on the EUR/JPY cross to navigate the area around the three-month low of 180.81, recorded on February 12, followed by the lower boundary of the descending triangle around 180.40. A break below the triangle would expose the four-month low at 175.70, recorded on November 5.
(The technical analysis of this story was written with the help of an AI tool.)
Euro Price Today
The table below shows the percentage change of Euro (EUR) against listed major currencies today. Euro was the weakest against the Australian Dollar.
| USD | EUR | GBP | JPY | CAD | AUD | NZD | CHF | |
|---|---|---|---|---|---|---|---|---|
| USD | 0.04% | -0.02% | -0.03% | 0.07% | -0.06% | 0.01% | 0.10% | |
| EUR | -0.04% | -0.05% | -0.06% | 0.03% | -0.11% | -0.05% | 0.05% | |
| GBP | 0.02% | 0.05% | -0.02% | 0.08% | -0.05% | 0.01% | 0.09% | |
| JPY | 0.03% | 0.06% | 0.02% | 0.09% | -0.02% | 0.01% | 0.09% | |
| CAD | -0.07% | -0.03% | -0.08% | -0.09% | -0.13% | -0.08% | 0.02% | |
| AUD | 0.06% | 0.11% | 0.05% | 0.02% | 0.13% | 0.06% | 0.15% | |
| NZD | -0.01% | 0.05% | -0.01% | -0.01% | 0.08% | -0.06% | 0.08% | |
| CHF | -0.10% | -0.05% | -0.09% | -0.09% | -0.02% | -0.15% | -0.08% |
The heat map shows percentage changes of major currencies against each other. The base currency is picked from the left column, while the quote currency is picked from the top row. For example, if you pick the Euro from the left column and move along the horizontal line to the US Dollar, the percentage change displayed in the box will represent EUR (base)/USD (quote).
Nothing in this material constitutes investment advice, personal recommendation, investment research, an offer, or a solicitation to buy or sell any financial instrument. The content has been prepared without consideration of your individual investment objectives, financial situation, or needs, and should not be treated as such.
Past performance is not a reliable indicator of future performance and/or results. Forward-looking scenarios or forecasts are not a guarantee of future performance. Actual results may differ materially from those anticipated.
Mitrade makes no representation or warranty as to the accuracy or completeness of the information provided and accepts no liability for any loss arising from reliance on such information.
Recommended Articles


