



GBP/USD Price Forecast: 50% Fibo retracement near 1.3500 acts as key support zone
- GBP/USD flattens around 1.3500 while investors await the official announcement of the second round of US-Iran talks.
- US President Trump states that Iran is willing to hand over its enriched uranium.
- Investors await the key UK employment and inflation data.
The Pound Sterling (GBP) trades almost flat against the US Dollar (USD) at around 1.3530 during the European trading session on Friday. The GBP/USD pair consolidates as the US Dollar gains temporary ground, while investors seek further development on negotiations between the United States (US) and Iran regarding a permanent ceasefire.
During the press time, the US Dollar Index (DXY), which tracks the Greenback’s value against six major currencies, trades flat around 98.20, but is close to its over six-week low of 97.83 posted on Thursday.
While there is no official announcement of the second round of US-Iran talks, US President Donald Trump has expressed confidence that Washington is very close to making a deal with Tehran, adding that the nation seems more willing to give up enriched uranium than in their previous talks.
In the United Kingdom (UK), investors await the labor market data for the three months ending February and the Consumer Price Index (CPI) data for March, which will be released next week. Investors will pay close attention to the UK data to get fresh cues on the Bank of England’s (BoE) monetary policy outlook.
GBP/USD technical analysis
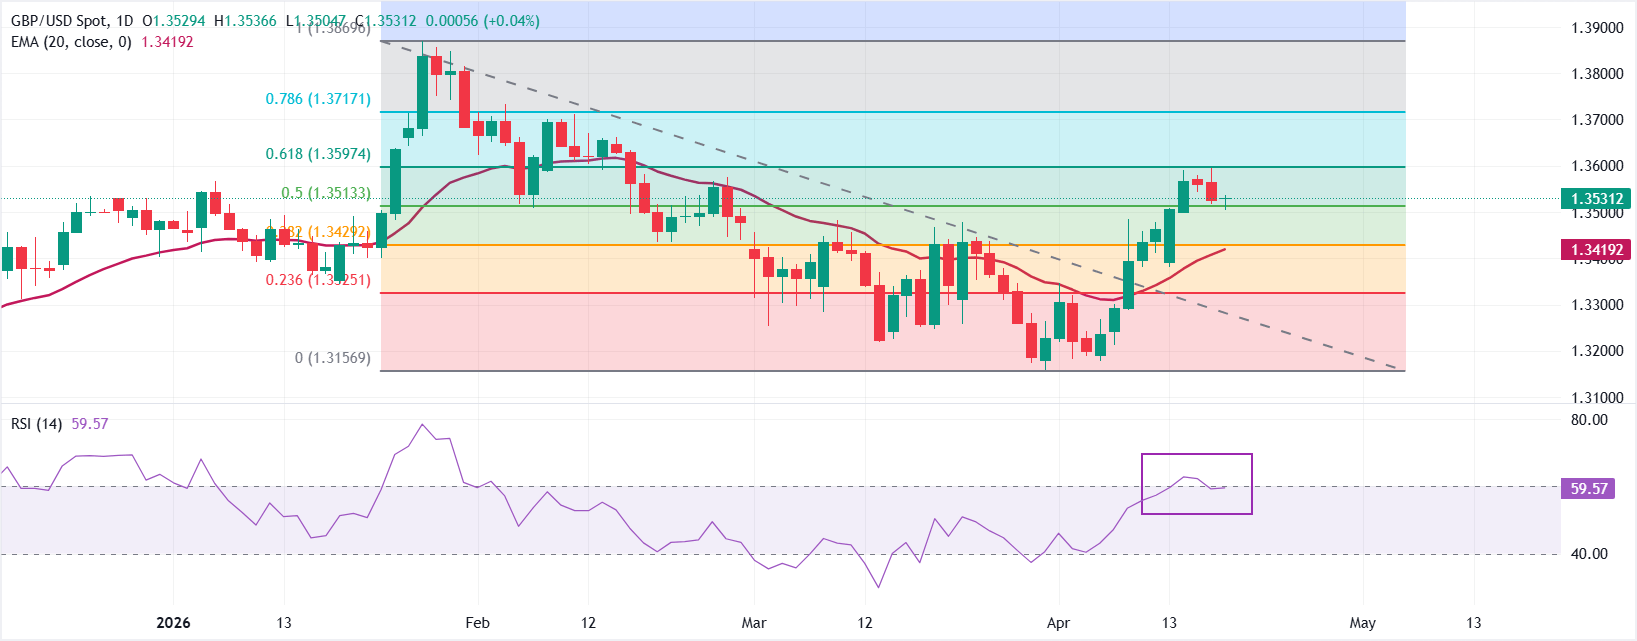
GBP/USD trades flat at around 1.3530, maintaining a constructive bullish bias as it holds above the 20-day Exponential Moving Average (EMA) at 1.3419 and the 50% Fibonacci retracement at 1.3513.
The Relative Strength Index (RSI) at 59.6 remains below overbought territory yet leans to the upside, suggesting buyers still retain control while the latest advance pauses below higher retracement hurdles.
On the topside, initial resistance is aligned at the 61.8% Fibonacci retracement at 1.3597, with further barriers at the 78.6% level near 1.3717 and the cycle high region around the 100% retracement at 1.3870. On the downside, immediate support sits at the 50% retracement at 1.3513, followed by a dense demand band around the 38.2% retracement at 1.3429 and the 20-day EMA at 1.3419; a deeper pullback would expose the 23.6% retracement at 1.3325 before the structural floor near 1.3157.
(The technical analysis of this story was written with the help of an AI tool.)
Risk sentiment FAQs
In the world of financial jargon the two widely used terms “risk-on” and “risk off'' refer to the level of risk that investors are willing to stomach during the period referenced. In a “risk-on” market, investors are optimistic about the future and more willing to buy risky assets. In a “risk-off” market investors start to ‘play it safe’ because they are worried about the future, and therefore buy less risky assets that are more certain of bringing a return, even if it is relatively modest.
Typically, during periods of “risk-on”, stock markets will rise, most commodities – except Gold – will also gain in value, since they benefit from a positive growth outlook. The currencies of nations that are heavy commodity exporters strengthen because of increased demand, and Cryptocurrencies rise. In a “risk-off” market, Bonds go up – especially major government Bonds – Gold shines, and safe-haven currencies such as the Japanese Yen, Swiss Franc and US Dollar all benefit.
The Australian Dollar (AUD), the Canadian Dollar (CAD), the New Zealand Dollar (NZD) and minor FX like the Ruble (RUB) and the South African Rand (ZAR), all tend to rise in markets that are “risk-on”. This is because the economies of these currencies are heavily reliant on commodity exports for growth, and commodities tend to rise in price during risk-on periods. This is because investors foresee greater demand for raw materials in the future due to heightened economic activity.
The major currencies that tend to rise during periods of “risk-off” are the US Dollar (USD), the Japanese Yen (JPY) and the Swiss Franc (CHF). The US Dollar, because it is the world’s reserve currency, and because in times of crisis investors buy US government debt, which is seen as safe because the largest economy in the world is unlikely to default. The Yen, from increased demand for Japanese government bonds, because a high proportion are held by domestic investors who are unlikely to dump them – even in a crisis. The Swiss Franc, because strict Swiss banking laws offer investors enhanced capital protection.
Nothing in this material constitutes investment advice, personal recommendation, investment research, an offer, or a solicitation to buy or sell any financial instrument. The content has been prepared without consideration of your individual investment objectives, financial situation, or needs, and should not be treated as such.
Past performance is not a reliable indicator of future performance and/or results. Forward-looking scenarios or forecasts are not a guarantee of future performance. Actual results may differ materially from those anticipated.
Mitrade makes no representation or warranty as to the accuracy or completeness of the information provided and accepts no liability for any loss arising from reliance on such information.
Recommended Articles


