



EUR/GBP Price Forecasts: Holds losses near 0.8655 after Eurozone, UK data
- EUR/GBP hovers above the 0.8655 support area, after dropping nearly 0.7% this week.
- Hot Eurozone inflation numbers add pressure to the ECB to hike interest rates,
- Softer-than-expected UK CPI data has weighed moderately on the Pound
The Euro (EUR) nurses minor losses against the British Pound (GBP) on Wednesday, trading right above the 0.8655 support area, after losing nearly 0.7% so far this week. UK inflation data put some pressure on the Pound, but the Eurozone’s final Harmonized Index of Consumer Prices (HICP) has failed to support the Euro.
Eurozone HICP confirmed that yearly inflation rose to 3% in April from 2.6% in March, adding pressure on the European Central Bank to hike interest rates, in spite of the weakening economic activity. In the UK, on the other hand, consumer inflation eased beyond expectations in April, providing some leeway to the Bank of England to keep its monetary policy unchanged in June. The Pound reacted with moderate declines.
Technical Analysis: Bears eye one-week lows at 0.8645
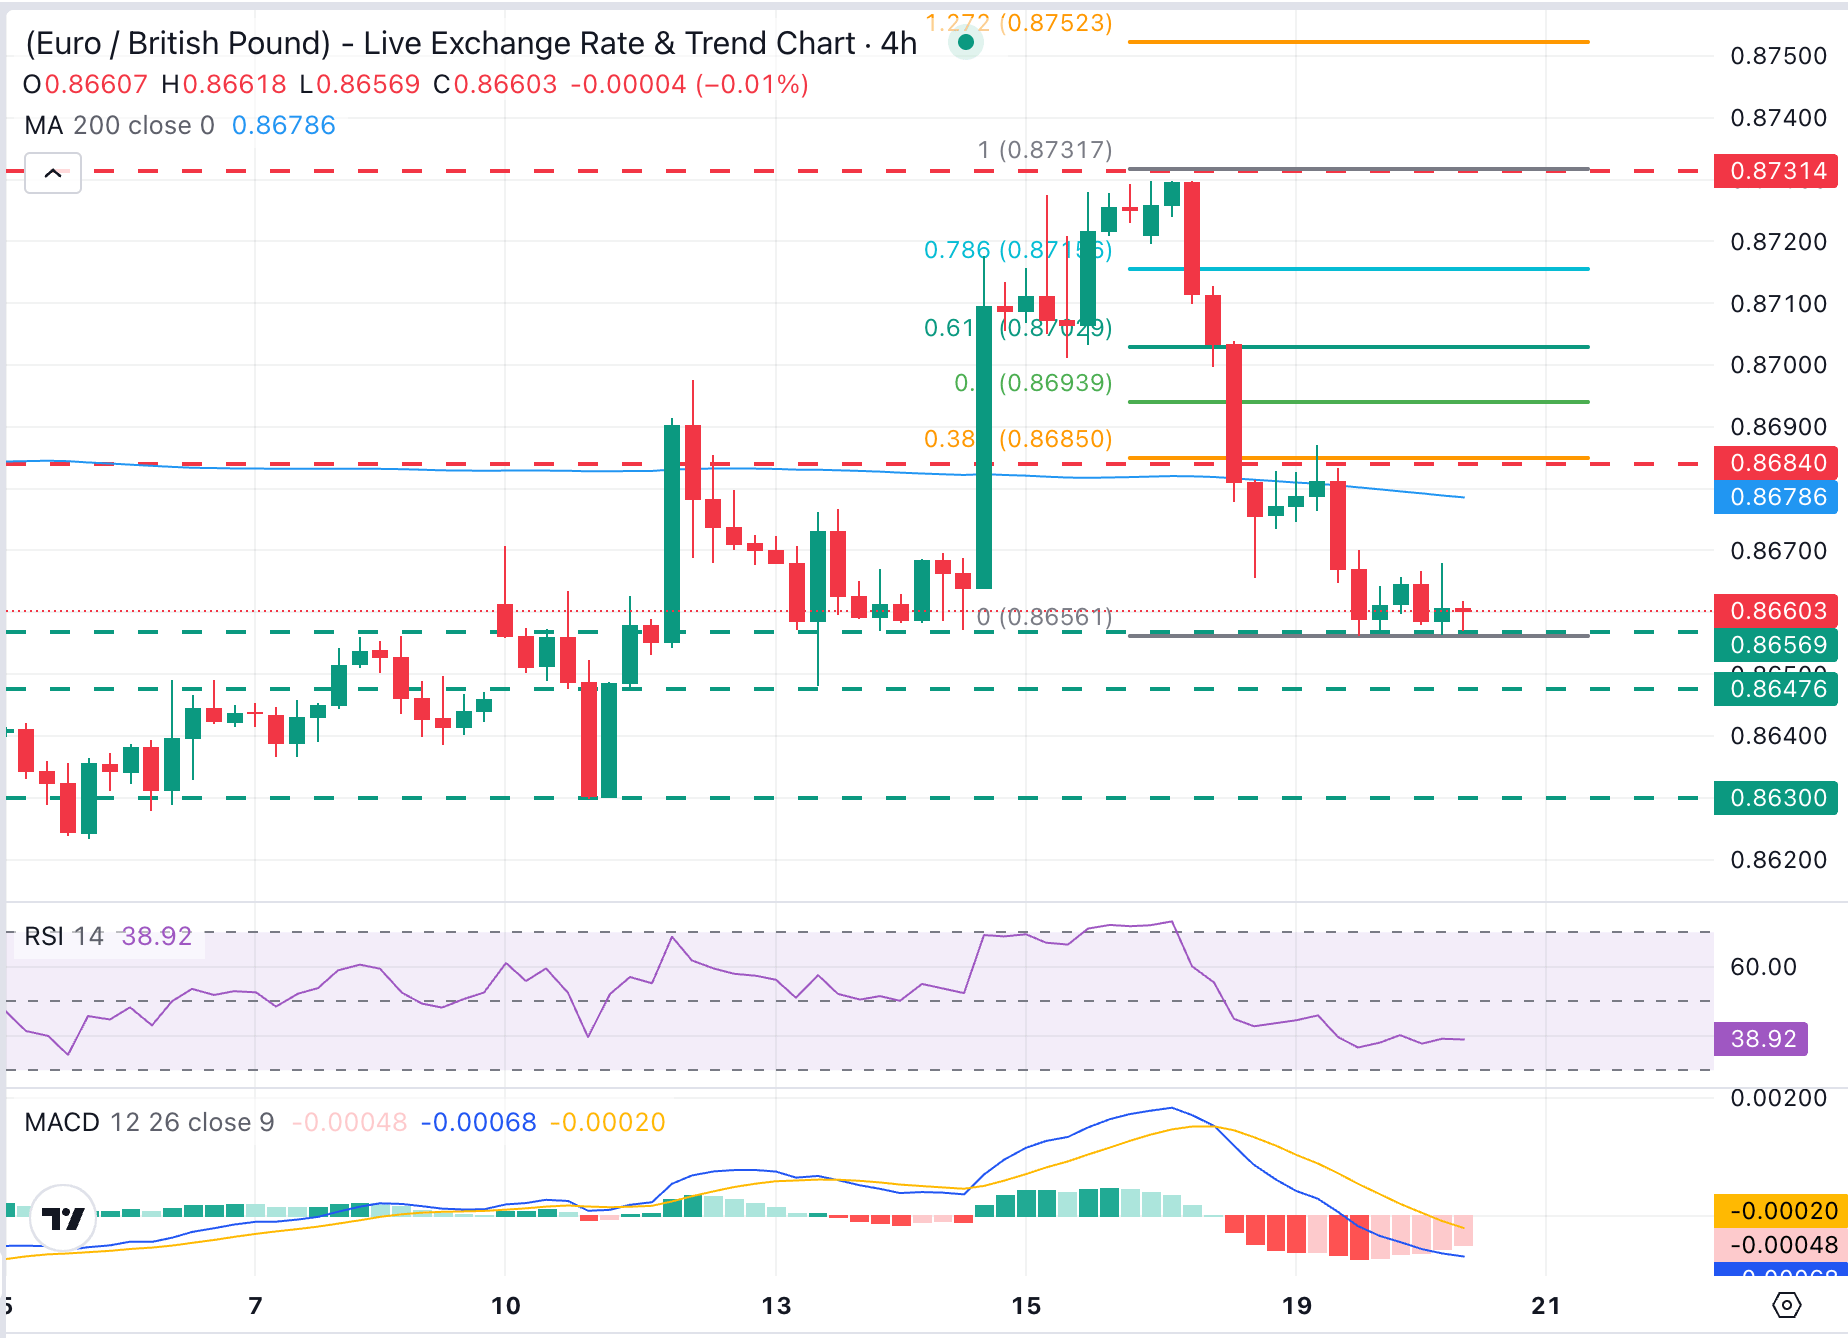
EUR/GBP's immediate trend shifted to bearish this week, after a sharp reversal from last week's highs. The 4-Hour Relative Strength Index (RSI) sits around 39, hinting at lingering downside pressure, while the Moving Average Convergence Divergence (MACD) remains in negative territory, suggesting that recent rebounds are corrective.
Bears are pushing against the mentioned 0.8655 area, with the focus on the weekly low, near 0.8645. Further down, the target is the May 11 low, at 0.8630.
The pair confirmed the break of the 200-period moving average in the 4-hour charts, an indicator closely observed by traders, which is likely to offer significant resistance near 0.8680, together with the 38.2% Fibonacci retracement of this week's sell-off and Tuesday's high above 0.8685. Further up, the 61.8% Fibonacci retracement is coincident with the March 15 lows in the 0.8700 area.
(The technical analysis of this story was written with the help of an AI tool.)
Euro Price This week
The table below shows the percentage change of Euro (EUR) against listed major currencies this week. Euro was the strongest against the Australian Dollar.
| USD | EUR | GBP | JPY | CAD | AUD | NZD | CHF | |
|---|---|---|---|---|---|---|---|---|
| USD | 0.17% | -0.55% | 0.14% | 0.14% | 0.38% | 0.02% | 0.37% | |
| EUR | -0.17% | -0.73% | 0.04% | -0.05% | 0.20% | -0.08% | 0.17% | |
| GBP | 0.55% | 0.73% | 0.70% | 0.70% | 0.92% | 0.66% | 0.89% | |
| JPY | -0.14% | -0.04% | -0.70% | -0.05% | 0.17% | -0.17% | 0.19% | |
| CAD | -0.14% | 0.05% | -0.70% | 0.05% | 0.23% | -0.12% | 0.20% | |
| AUD | -0.38% | -0.20% | -0.92% | -0.17% | -0.23% | -0.28% | 0.05% | |
| NZD | -0.02% | 0.08% | -0.66% | 0.17% | 0.12% | 0.28% | 0.23% | |
| CHF | -0.37% | -0.17% | -0.89% | -0.19% | -0.20% | -0.05% | -0.23% |
The heat map shows percentage changes of major currencies against each other. The base currency is picked from the left column, while the quote currency is picked from the top row. For example, if you pick the Euro from the left column and move along the horizontal line to the US Dollar, the percentage change displayed in the box will represent EUR (base)/USD (quote).
Nothing in this material constitutes investment advice, personal recommendation, investment research, an offer, or a solicitation to buy or sell any financial instrument. The content has been prepared without consideration of your individual investment objectives, financial situation, or needs, and should not be treated as such.
Past performance is not a reliable indicator of future performance and/or results. Forward-looking scenarios or forecasts are not a guarantee of future performance. Actual results may differ materially from those anticipated.
Mitrade makes no representation or warranty as to the accuracy or completeness of the information provided and accepts no liability for any loss arising from reliance on such information.
Recommended Articles


