



GBP/JPY Price Forecasts: Pound picks up to 213.80 as US-Iran conflict escalates
- GBP/JPY bounces up to 213.80 but is heading lower for the fourth consecutive day.
- Fading hopes of a swift end to the US-Iran war are pushing Oil higher and weighing on the Yen.
- The pair is on a bearish correction after last week's bullish run.
The British Pound (GBP) remains on the back foot against the Japanese Yen (JPY) on Thursday, although the pair has regained most of the ground lost during the Asian session, returning to the 213.80 area at the time of writing, from weekly lows at 213.33. The escalating tensions between the US and Iran and the uptick in Oil prices have added weight to the Japanese Yen.
Reports of fresh US attacks on military sites in Iran’s province of Bandar Abbas cast further doubts about the fate of a fragile ceasefire and push back hopes of an upcoming reopening of the Strait of Hormuz. Brent Oil prices have picked up to $94.30 from lows around $92.00 on Wednesday, and the WTI barrel is hovering near $90, from below $87 the day before. These prices pose a serious threat to the Japanese Oil-importing economy and act as headwinds for JPY rallies.
Technical Analysis: The pair is going through a bearish correction
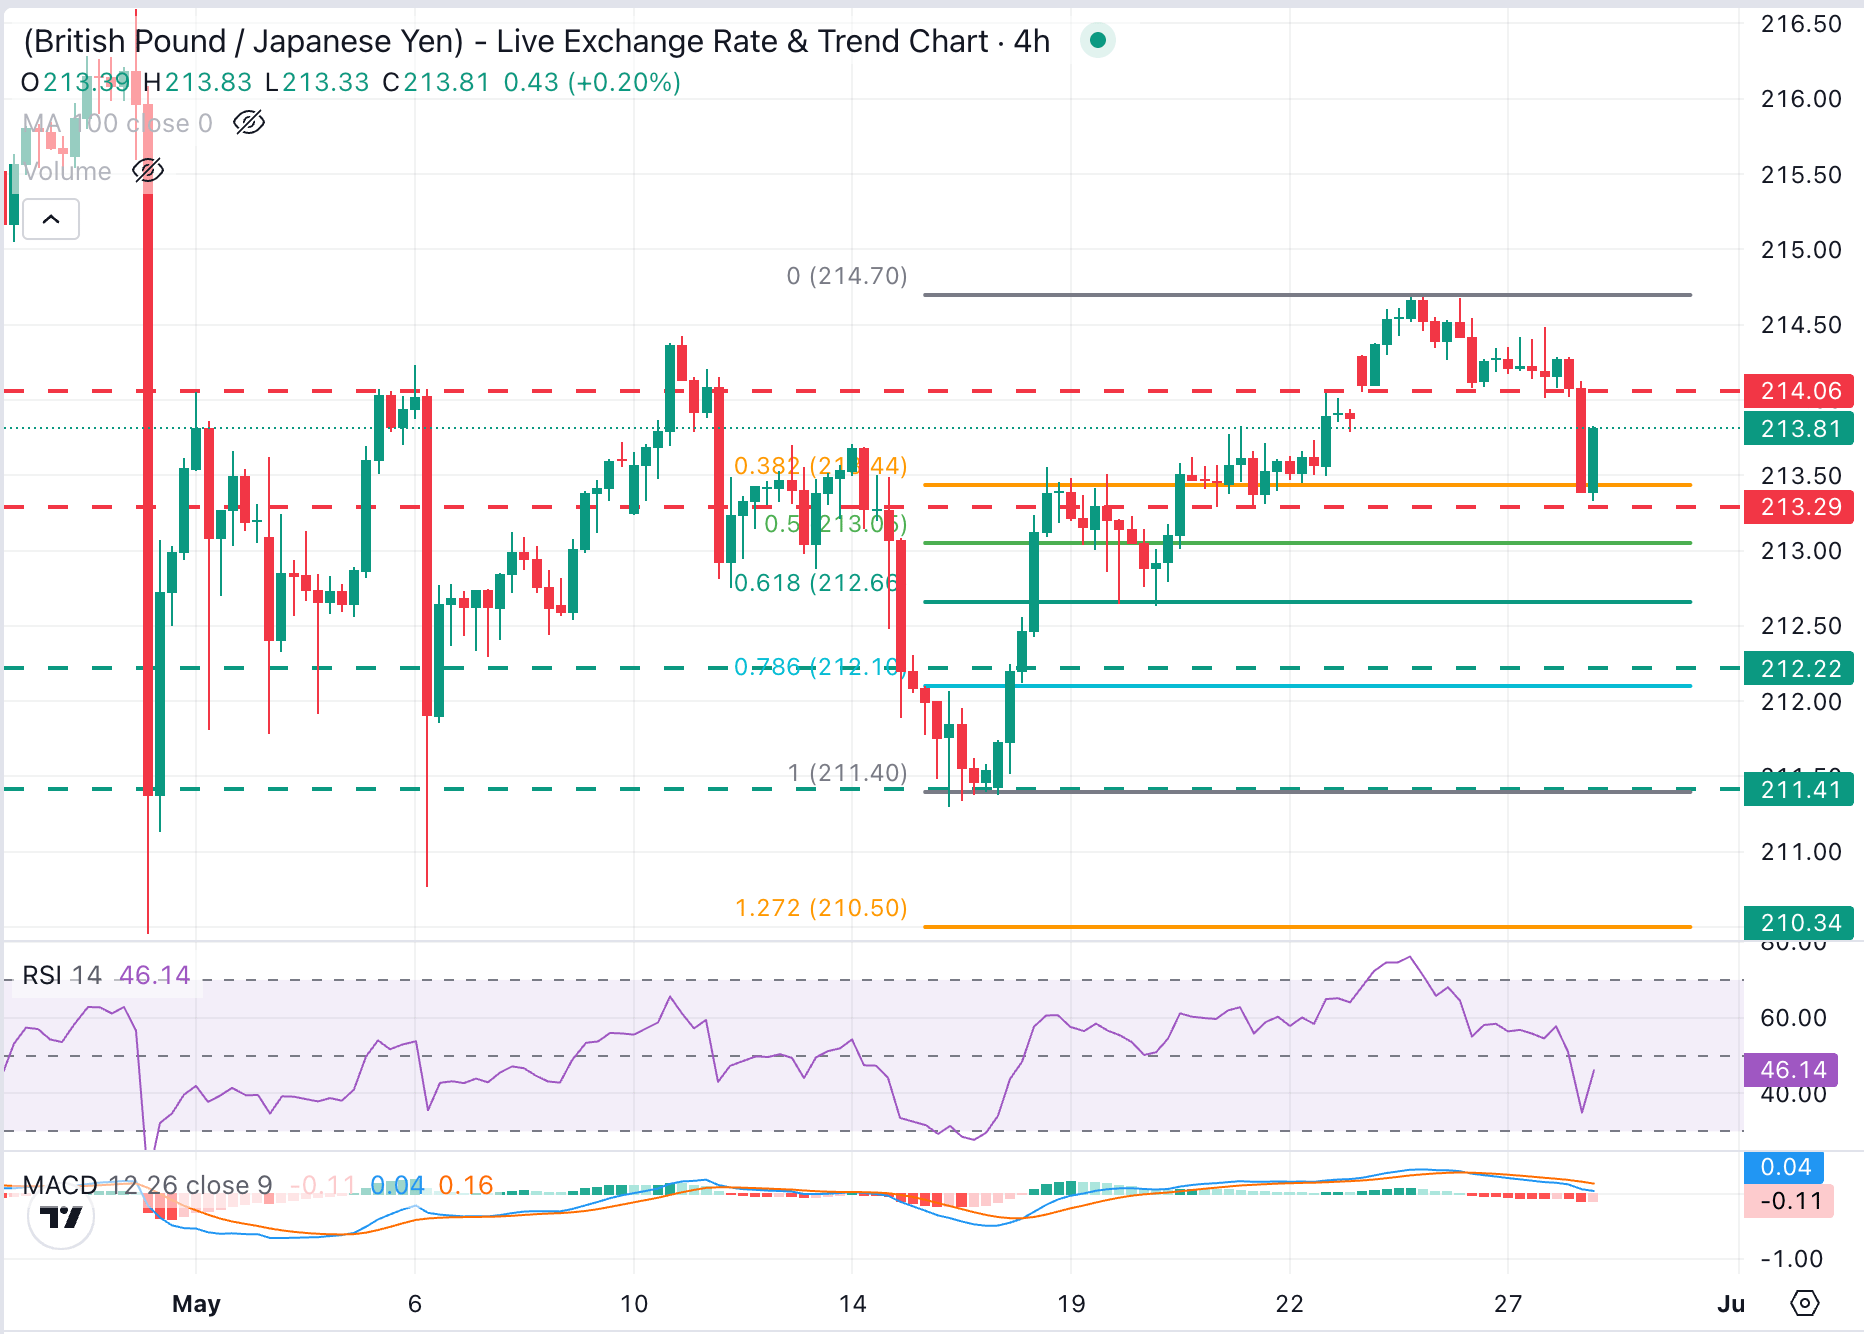
GBP/JPY is going through a bearish correction after reaching overbought levels earlier this week. Indicators show a cooling momentum with the Relative Strength Index (RSI) slipping toward the mid-40s and the Moving Average Convergence Divergence (MACD) line below zero, which suggests that bulls are losing near-term traction.
Downside attempts remain contained above the 213.30 area (May 21 lows) for now. Further down, the 61.8% Fibonacci retracement of last week's rally, at 212.65, is a common target for corrections and is coincident with the May 19 and 20 lows.
On the upside, the previous support area right above 214.00 (Wednesday's low) is likely to test the bulls' commitment. A confirmation above here would restore buyers' confidence in control and expose the monthly highs between 214.50 and 214.70.
(The technical analysis of this story was written with the help of an AI tool.)
Japanese Yen Price Today
The table below shows the percentage change of Japanese Yen (JPY) against listed major currencies today. Japanese Yen was the strongest against the Australian Dollar.
| USD | EUR | GBP | JPY | CAD | AUD | NZD | CHF | |
|---|---|---|---|---|---|---|---|---|
| USD | 0.08% | 0.12% | -0.02% | 0.05% | 0.23% | 0.15% | 0.05% | |
| EUR | -0.08% | 0.04% | -0.13% | -0.03% | 0.16% | 0.10% | -0.03% | |
| GBP | -0.12% | -0.04% | -0.17% | -0.08% | 0.11% | 0.05% | -0.09% | |
| JPY | 0.02% | 0.13% | 0.17% | 0.06% | 0.25% | 0.16% | 0.07% | |
| CAD | -0.05% | 0.03% | 0.08% | -0.06% | 0.19% | 0.11% | -0.00% | |
| AUD | -0.23% | -0.16% | -0.11% | -0.25% | -0.19% | -0.06% | -0.19% | |
| NZD | -0.15% | -0.10% | -0.05% | -0.16% | -0.11% | 0.06% | -0.12% | |
| CHF | -0.05% | 0.03% | 0.09% | -0.07% | 0.00% | 0.19% | 0.12% |
The heat map shows percentage changes of major currencies against each other. The base currency is picked from the left column, while the quote currency is picked from the top row. For example, if you pick the Japanese Yen from the left column and move along the horizontal line to the US Dollar, the percentage change displayed in the box will represent JPY (base)/USD (quote).
Nothing in this material constitutes investment advice, personal recommendation, investment research, an offer, or a solicitation to buy or sell any financial instrument. The content has been prepared without consideration of your individual investment objectives, financial situation, or needs, and should not be treated as such.
Past performance is not a reliable indicator of future performance and/or results. Forward-looking scenarios or forecasts are not a guarantee of future performance. Actual results may differ materially from those anticipated.
Mitrade makes no representation or warranty as to the accuracy or completeness of the information provided and accepts no liability for any loss arising from reliance on such information.
Recommended Articles


