



EUR/USD Price Forecast: Flag breakdown supports more downside towards 1.1325
- EUR/USD trades lower at around 1.1390 as the US Dollar strengthens.
- Increased aggression between the US and Iran has improved the US Dollar’s safe-haven demand.
- Investors await Fed Chair Warsh’s testimony and the US CPI data.
The Euro (EUR) holds opening losses at around 1.1390 against the US Dollar (USD) during the mid-Asian trading session on Monday. The major currency pair faces selling pressure as the US Dollar starts the week on a strong note due to an increase in the appeal of safe-haven assets.
At press time, the US Dollar Index (DXY), which gauges the Greenback’s value against six major currencies, trades 0.2% higher to near 101.15.
Escalating military actions between the United States (US) and Iran over Tehran showing dominance over the Strait of Hormuz, a critical chokepoint to almost 20% of global energy supply, have forced investors to shift to the safe-haven fleet and have de-anchored inflation expectations.
To get cues regarding the current status of US inflation, investors will pay close attention to the Consumer Price Index (CPI) data for June, which will be released on Tuesday.
This week, investors will also focus on Federal Reserve (Fed) Chair Kevin Warsh’s two-day testimony before Congress starting on Tuesday.
Technical Analysis:
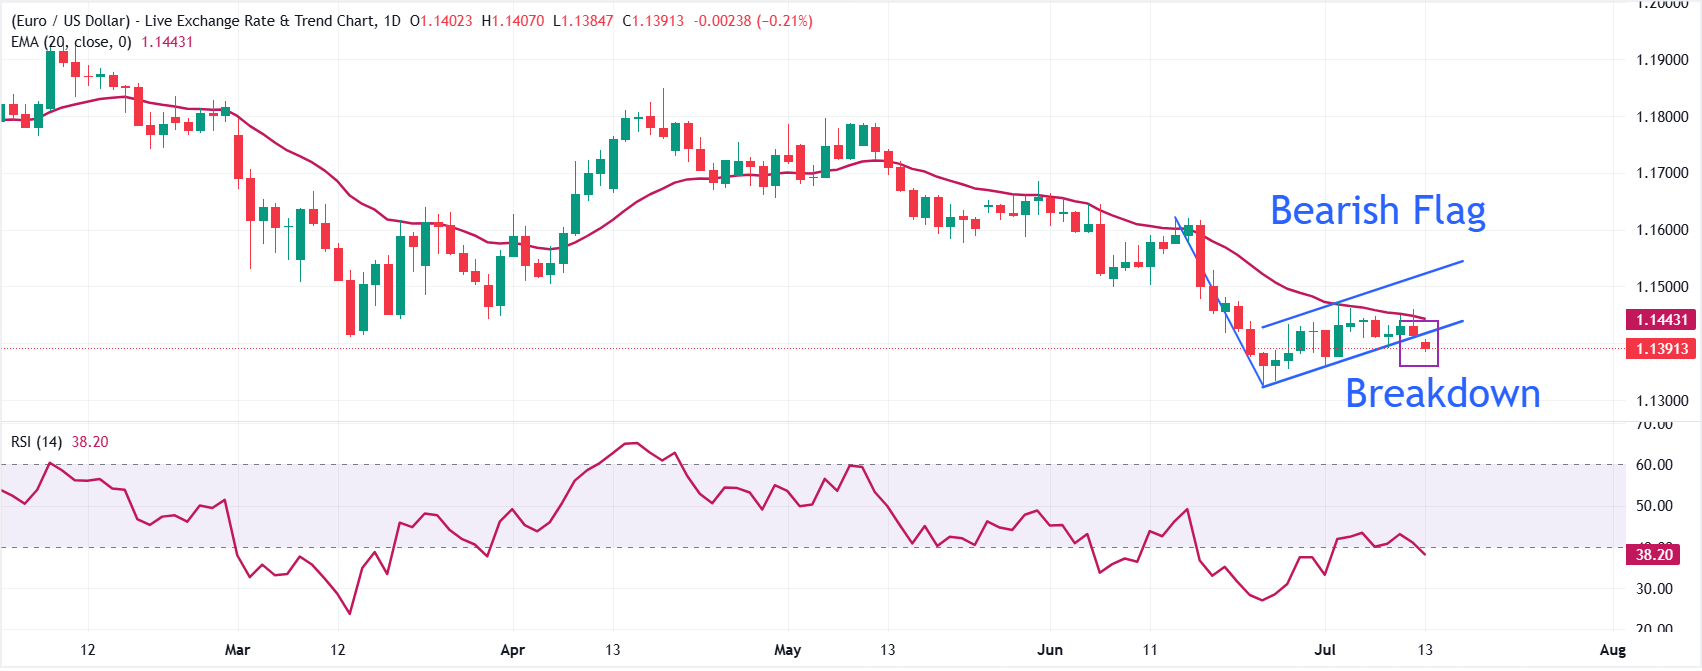
EUR/USD trades lower at around 1.1390, keeping a bearish near-term tone as spot holds beneath the 20-period Exponential Moving Average (EMA) at 1.1443 and a breakdown of the Bearish Flag formation.
The Relative Strength Index (14) hovers near 38, hinting at persistent but not extreme downside momentum.
On the topside, initial resistance is aligned with the lower boundary of the parallel channel near 1.1424, followed by the 20-period EMA at 1.1443, with the channel top around 1.1530 acting as a stronger cap if a rebound extends. On the downside, major support levels are the June 24 low at 1.1324, followed by 1.1300.
(The technical analysis of this story was written with the help of an AI tool. Know more.)
Risk sentiment FAQs
In the world of financial jargon the two widely used terms “risk-on” and “risk off'' refer to the level of risk that investors are willing to stomach during the period referenced. In a “risk-on” market, investors are optimistic about the future and more willing to buy risky assets. In a “risk-off” market investors start to ‘play it safe’ because they are worried about the future, and therefore buy less risky assets that are more certain of bringing a return, even if it is relatively modest.
Typically, during periods of “risk-on”, stock markets will rise, most commodities – except Gold – will also gain in value, since they benefit from a positive growth outlook. The currencies of nations that are heavy commodity exporters strengthen because of increased demand, and Cryptocurrencies rise. In a “risk-off” market, Bonds go up – especially major government Bonds – Gold shines, and safe-haven currencies such as the Japanese Yen, Swiss Franc and US Dollar all benefit.
The Australian Dollar (AUD), the Canadian Dollar (CAD), the New Zealand Dollar (NZD) and minor FX like the Ruble (RUB) and the South African Rand (ZAR), all tend to rise in markets that are “risk-on”. This is because the economies of these currencies are heavily reliant on commodity exports for growth, and commodities tend to rise in price during risk-on periods. This is because investors foresee greater demand for raw materials in the future due to heightened economic activity.
The major currencies that tend to rise during periods of “risk-off” are the US Dollar (USD), the Japanese Yen (JPY) and the Swiss Franc (CHF). The US Dollar, because it is the world’s reserve currency, and because in times of crisis investors buy US government debt, which is seen as safe because the largest economy in the world is unlikely to default. The Yen, from increased demand for Japanese government bonds, because a high proportion are held by domestic investors who are unlikely to dump them – even in a crisis. The Swiss Franc, because strict Swiss banking laws offer investors enhanced capital protection.
Nothing in this material constitutes investment advice, personal recommendation, investment research, an offer, or a solicitation to buy or sell any financial instrument. The content has been prepared without consideration of your individual investment objectives, financial situation, or needs, and should not be treated as such.
Past performance is not a reliable indicator of future performance and/or results. Forward-looking scenarios or forecasts are not a guarantee of future performance. Actual results may differ materially from those anticipated.
Mitrade makes no representation or warranty as to the accuracy or completeness of the information provided and accepts no liability for any loss arising from reliance on such information.
Recommended Articles


