



NZD/USD Price Forecast: Sees fresh downside leg below 0.5700
- NZD/USD edges up amid Trump-Xi meeting optimism.
- The Fed is expected to hike interest rates further this year.
- Fed’s hawkish dot plot builds hopes of further policy tightening.
The New Zealand Dollar (NZD) trades marginally higher against the US Dollar (USD) at around 0.5727 during the European trading session on Monday even as the US Dollar Index (DXY) is positive. At press time, the USD Index is up 0.1% higher to near 100.31.
New Zealand Dollar Price Today
The table below shows the percentage change of New Zealand Dollar (NZD) against listed major currencies today. New Zealand Dollar was the strongest against the Canadian Dollar.
| USD | EUR | GBP | JPY | CAD | AUD | NZD | CHF | |
|---|---|---|---|---|---|---|---|---|
| USD | -0.04% | 0.05% | 0.16% | 0.16% | -0.11% | -0.14% | 0.03% | |
| EUR | 0.04% | 0.03% | 0.13% | 0.12% | -0.13% | -0.19% | 0.01% | |
| GBP | -0.05% | -0.03% | 0.13% | 0.10% | -0.15% | -0.23% | 0.00% | |
| JPY | -0.16% | -0.13% | -0.13% | 0.01% | -0.29% | -0.28% | -0.07% | |
| CAD | -0.16% | -0.12% | -0.10% | -0.01% | -0.30% | -0.31% | -0.10% | |
| AUD | 0.11% | 0.13% | 0.15% | 0.29% | 0.30% | -0.03% | 0.18% | |
| NZD | 0.14% | 0.19% | 0.23% | 0.28% | 0.31% | 0.03% | 0.20% | |
| CHF | -0.03% | -0.01% | -0.00% | 0.07% | 0.10% | -0.18% | -0.20% |
The heat map shows percentage changes of major currencies against each other. The base currency is picked from the left column, while the quote currency is picked from the top row. For example, if you pick the New Zealand Dollar from the left column and move along the horizontal line to the US Dollar, the percentage change displayed in the box will represent NZD (base)/USD (quote).
The antipodean gains on optimism over the meeting between Chinese leader XI Jinping and United States (US) President Donald Trump, which will likely take place in the September 23-25 period.
The meeting aims at clearing the way for possible agreements on trade, Artificial Intelligence (AI) and critical minerals, Bloomberg reported on Sunday.
Given that New Zealand is one of key trading partners of China, an improvement in Beijing’s economic outlook bodes well for the New Zealand Dollar.
Meanwhile, the US Dollar trades broadly firm amid the expectations that the Federal Reserve (Fed) will deliver more interest rate hikes this year.
Dollar support builds as Fed dots back further tightening
Analysts at HSBC note that the USD “strengthened following the decision,” even though the 25bp move was widely anticipated, as “the unanimous vote reinforced confidence in the Committee’s tightening bias.” They highlight that “the median 2026 ‘dot’ implies one additional hike before year-end,” with “a significant minority of participants still anticipating a further rate rise in 2027.” HSBC argues that “this path is more hawkish than a ‘one-and-done’ outcome but remains below current market pricing,” meaning they “do not expect a major repricing of rate expectations or the USD.” Instead, the bank expects that “the market’s attention is likely to focus on whether incoming data validate the final projected increase this year,” suggesting any further Dollar gains will hinge on how the data track against the Fed’s projected path.
NZD/USD Technical Analysis
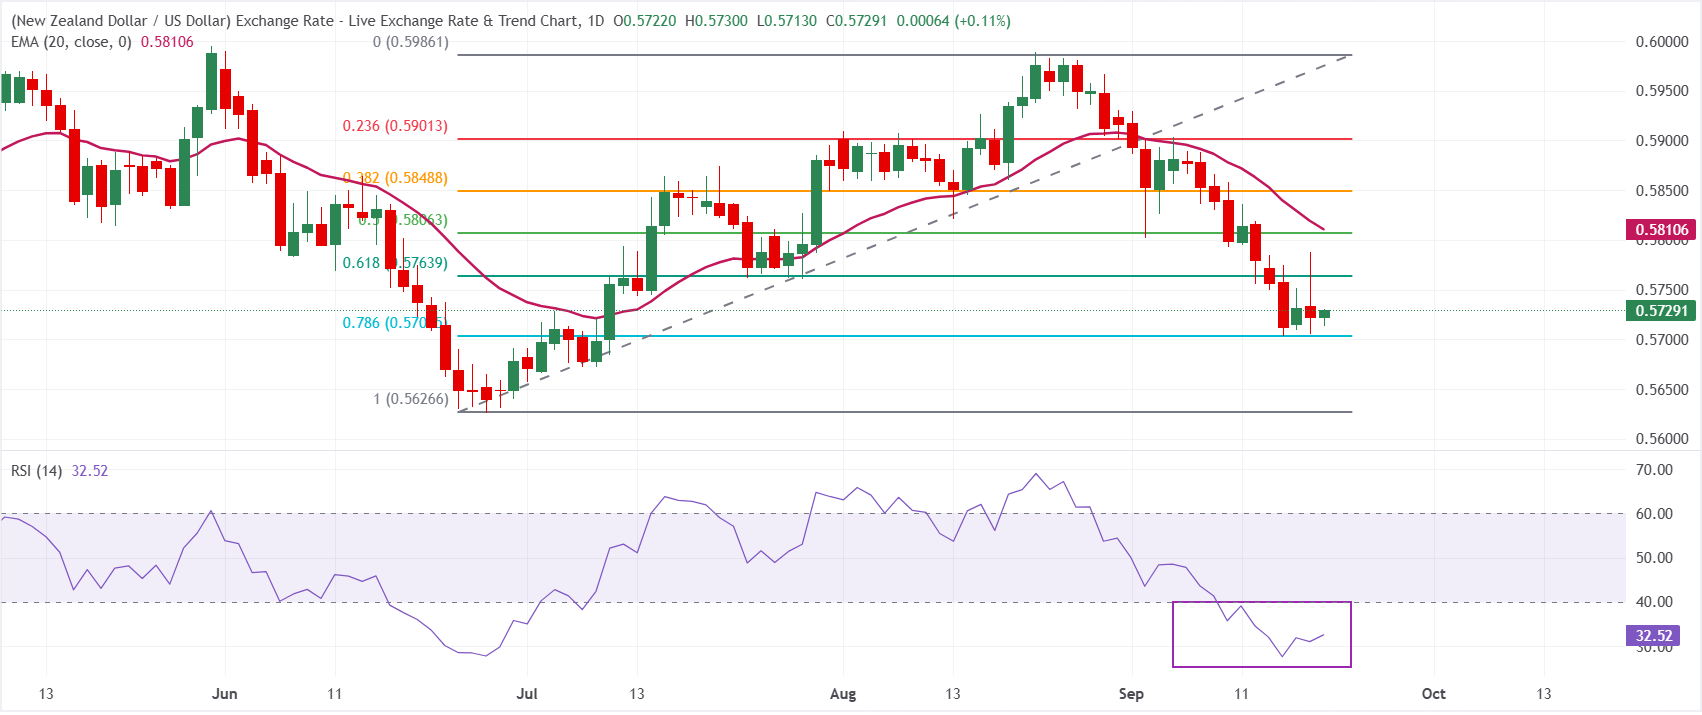
NZD/USD trades at around 0.5729, keeping a bearish near-term tone as it holds below the 20-period exponential moving average (EMA) at 0.5811 and a dense Fibonacci retracement cluster.
The 14-period Relative Strength Index hovers near 33, hinting at persistent downside pressure but not yet an extreme oversold condition, which suggests sellers still retain control while allowing room for further declines before a meaningful corrective bounce.
On the topside, immediate resistance emerges at the 61.8% Fibonacci retracement at 0.5764, followed by the 50.0% retracement at 0.5806 and the 20-period EMA at 0.5811, with higher obstacles at the 38.2% level at 0.5849 and the 23.6% retracement at 0.5901 before the recent swing high region near 0.5986. On the downside, initial support appears at the 78.6% retracement at 0.5704, with a deeper cushion at the 100.0% Fibonacci anchor around 0.5627, where buyers may attempt to slow or reverse the current slide.
(The technical analysis of this story was written with the help of an AI tool. Know more.)
Economic Indicator
Fed Interest Rate Decision
The Federal Reserve (Fed) deliberates on monetary policy and makes a decision on interest rates at eight pre-scheduled meetings per year. It has two mandates: to keep inflation at 2%, and to maintain full employment. Its main tool for achieving this is by setting interest rates – both at which it lends to banks and banks lend to each other. If it decides to hike rates, the US Dollar (USD) tends to strengthen as it attracts more foreign capital inflows. If it cuts rates, it tends to weaken the USD as capital drains out to countries offering higher returns. If rates are left unchanged, attention turns to the tone of the Federal Open Market Committee (FOMC) statement, and whether it is hawkish (expectant of higher future interest rates), or dovish (expectant of lower future rates).
Read more.Last release: Wed Sep 16, 2026 18:00
Frequency: Irregular
Actual: 4%
Consensus: 4%
Previous: 3.75%
Source: Federal Reserve
Nothing in this material constitutes investment advice, personal recommendation, investment research, an offer, or a solicitation to buy or sell any financial instrument. The content has been prepared without consideration of your individual investment objectives, financial situation, or needs, and should not be treated as such.
Past performance is not a reliable indicator of future performance and/or results. Forward-looking scenarios or forecasts are not a guarantee of future performance. Actual results may differ materially from those anticipated.
Mitrade makes no representation or warranty as to the accuracy or completeness of the information provided and accepts no liability for any loss arising from reliance on such information.
Recommended Articles


