



GBP/JPY Price Forecast: Momentum stabilizes, but lacks bullish conviction
- GBP/JPY trades on the front foot as the Japanese Yen extends its post-BoJ decline.
- Technically, GBP/JPY remains below all major daily SMAs, keeping the near-term bias bearish.
- The MACD improves slightly near the zero line, suggesting tentative stabilization.
GBP/JPY edges higher on Monday as the Japanese Yen (JPY) stays under pressure across the board in thin trading conditions. Japanese markets are closed until Thursday for the country’s Silver Week holidays. At the time of writing, the cross trades around 210.55, extending gains for a second straight day.
Japanese Yen Price Today
The table below shows the percentage change of Japanese Yen (JPY) against listed major currencies today. Japanese Yen was the strongest against the Canadian Dollar.
| USD | EUR | GBP | JPY | CAD | AUD | NZD | CHF | |
|---|---|---|---|---|---|---|---|---|
| USD | -0.07% | 0.00% | 0.20% | 0.10% | -0.19% | -0.22% | -0.13% | |
| EUR | 0.07% | 0.00% | 0.23% | 0.13% | -0.16% | -0.23% | -0.11% | |
| GBP | -0.00% | -0.01% | 0.21% | 0.10% | -0.17% | -0.25% | -0.11% | |
| JPY | -0.20% | -0.23% | -0.21% | -0.10% | -0.43% | -0.41% | -0.29% | |
| CAD | -0.10% | -0.13% | -0.10% | 0.10% | -0.32% | -0.32% | -0.20% | |
| AUD | 0.19% | 0.16% | 0.17% | 0.43% | 0.32% | -0.02% | 0.09% | |
| NZD | 0.22% | 0.23% | 0.25% | 0.41% | 0.32% | 0.02% | 0.11% | |
| CHF | 0.13% | 0.11% | 0.11% | 0.29% | 0.20% | -0.09% | -0.11% |
The heat map shows percentage changes of major currencies against each other. The base currency is picked from the left column, while the quote currency is picked from the top row. For example, if you pick the Japanese Yen from the left column and move along the horizontal line to the US Dollar, the percentage change displayed in the box will represent JPY (base)/USD (quote).
The Yen fell sharply on Friday after the Bank of Japan (BoJ) raised its policy rate by 25 basis points (bps) to 1.25%. Traders viewed the decision as dovish because two policymakers voted against the increase, while Governor Kazuo Ueda offered limited guidance on the timing of the next move.
The Bank of England’s (BoE) decision to keep interest rates unchanged at 3.75% last week also weighed on the British Pound (GBP). However, persistent Yen weakness is overshadowing the pressure on Sterling and keeping GBP/JPY supported.
A wide interest-rate gap and elevated Oil prices amid war in the Middle East continue to weigh on the Yen. The Yen’s decline has also brought intervention risk back into focus. Reports that BoJ conducted a rate check during Friday’s American trading hours added to speculation that officials could step again into the foreign exchange market if the currency weakens rapidly.
Looking ahead, the economic calendar is relatively light this week. Preliminary Purchasing Managers' Index (PMI) data from the United Kingdom (UK) and Japan will be closely watched for fresh signs of economic activity. Traders will also watch speeches from BoE officials for more clues about the interest-rate outlook.
Technical Analysis
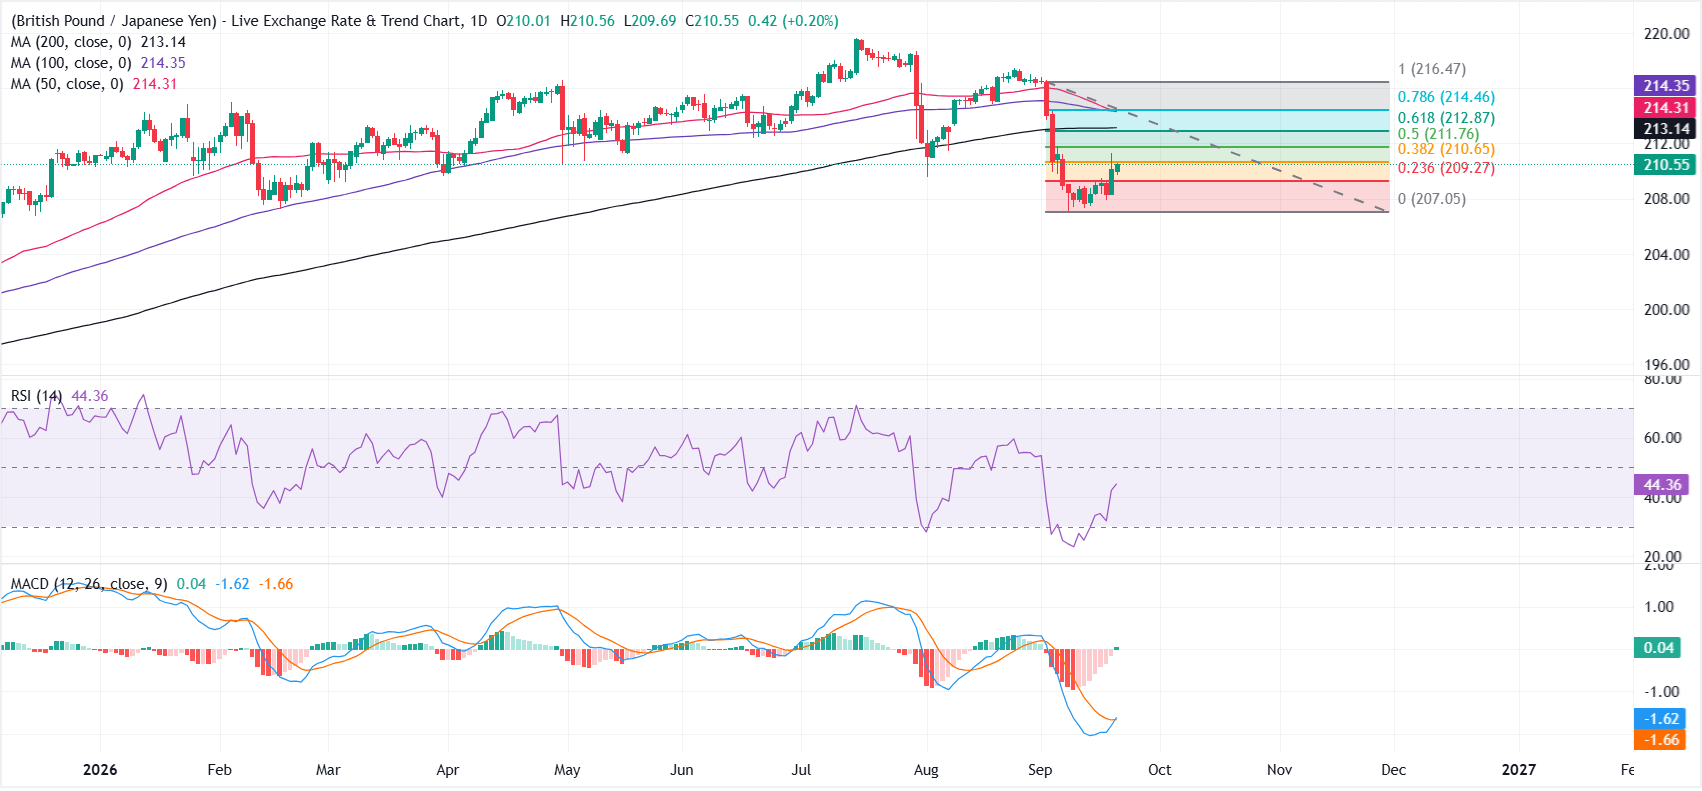
On the daily chart, GBP/JPY keeps a bearish near-term tone as spot holds beneath the 50-, 100- and 200-day Simple Moving Averages (SMAs) clustered between roughly 213.00 and 214.50. The pair is hovering just under the 38.2% Fibonacci retracement at 210.65, underscoring a capped recovery, while the Relative Strength Index around 44 hints at subdued demand despite a slightly positive Moving Average Convergence Divergence (MACD) reading near the zero line, which only suggests tentative stabilization rather than a clear bullish reversal.
On the topside, initial resistance appears at the 38.2% retracement at 210.65, followed by the 50.0% level at 211.76 and the 61.8% retracement at 212.87, before a denser barrier formed by the 200-day SMA at 213 and the 50- and 100-day SMAs around 214.30-214.35, with the 78.6% retracement at 214.46 and the prior swing high zone near 216.47 acting as higher caps.
On the downside, the 23.6% Fibonacci retracement at 209.27 offers initial support, ahead of the structural floor around 207.05, where the lower Fibonacci anchor aligns with the recent cycle low.
(The technical analysis of this story was written with the help of an AI tool. Know more.)
Bank of Japan FAQs
The Bank of Japan (BoJ) is the Japanese central bank, which sets monetary policy in the country. Its mandate is to issue banknotes and carry out currency and monetary control to ensure price stability, which means an inflation target of around 2%.
The Bank of Japan embarked in an ultra-loose monetary policy in 2013 in order to stimulate the economy and fuel inflation amid a low-inflationary environment. The bank’s policy is based on Quantitative and Qualitative Easing (QQE), or printing notes to buy assets such as government or corporate bonds to provide liquidity. In 2016, the bank doubled down on its strategy and further loosened policy by first introducing negative interest rates and then directly controlling the yield of its 10-year government bonds. In March 2024, the BoJ lifted interest rates, effectively retreating from the ultra-loose monetary policy stance.
The Bank’s massive stimulus caused the Yen to depreciate against its main currency peers. This process exacerbated in 2022 and 2023 due to an increasing policy divergence between the Bank of Japan and other main central banks, which opted to increase interest rates sharply to fight decades-high levels of inflation. The BoJ’s policy led to a widening differential with other currencies, dragging down the value of the Yen. This trend partly reversed in 2024, when the BoJ decided to abandon its ultra-loose policy stance.
A weaker Yen and the spike in global energy prices led to an increase in Japanese inflation, which exceeded the BoJ’s 2% target. The prospect of rising salaries in the country – a key element fuelling inflation – also contributed to the move.
Nothing in this material constitutes investment advice, personal recommendation, investment research, an offer, or a solicitation to buy or sell any financial instrument. The content has been prepared without consideration of your individual investment objectives, financial situation, or needs, and should not be treated as such.
Past performance is not a reliable indicator of future performance and/or results. Forward-looking scenarios or forecasts are not a guarantee of future performance. Actual results may differ materially from those anticipated.
Mitrade makes no representation or warranty as to the accuracy or completeness of the information provided and accepts no liability for any loss arising from reliance on such information.
Recommended Articles


