

Gold firms in muted trading amid rising conviction of Fed cut
- Gold steadies near $4,158 as markets price 85% odds of a December 25-bps Fed cut.
- Treasury yields below 4% support bullion as US data shows stable labor markets and cooling inflation.
- Russia–Ukraine peace signals may curb safe-haven demand, while China–Japan tensions keep Gold underpinned.
Gold (XAU/USD) remains firm during the North American session on Thursday amid a low-volume trading session as US markets remain closed in observance of the Thanksgiving holidays. At the time of writing, XAU/USD trades at $4,158, virtually unchanged.
XAU/USD stays firm in thin Thanksgiving liquidity as Fed easing expectations rise
On Thursday, Bullion prices seem to be consolidating amid the lack of news. However, the recent US government reopening opened the door for economic data, which so far reassured that the US jobs market remains solid and that inflation stalled and might resume its downward path.
This increased the chances of additional easing by the Federal Reserve (Fed), as shown by the CME FedWatch Tool with odds at 85% for a cut of 0.25% to 3.50%-3.75%.
A dovish Fed puts pressure on US Treasury bond yields, with the 10-year T-note yield diving below 4%. However, peace talks between Russia andUkraine could sap demand for Gold’s safe-haven status.
Contrarily, Japan-China tensions increased following Prime Minister Sanae Takaichi's remarks in support of Taiwan’s independence. Rising geopolitical risks could drive the Gold price higher, along with a Fed cutting rates.
Daily market movers: Gold holds firm despite strong US jobs data
- US Initial Jobless Claims rose by 216K in the week ending November 22, beneath forecasts for a 225K rise and down from the previous pricing of 222K. Unemployment claims reached their lowest level since April, an indication that the labor market is solid, despite cooling.
- Inflation in the US edged lower as the Core Producer Price Index (PPI) for September dipped. Retail Sales have shown signs that households are reducing spending.
- Physical Gold exports from Hong Kong to China dipped, an indication that the Bullion might remain subdued in the near term.
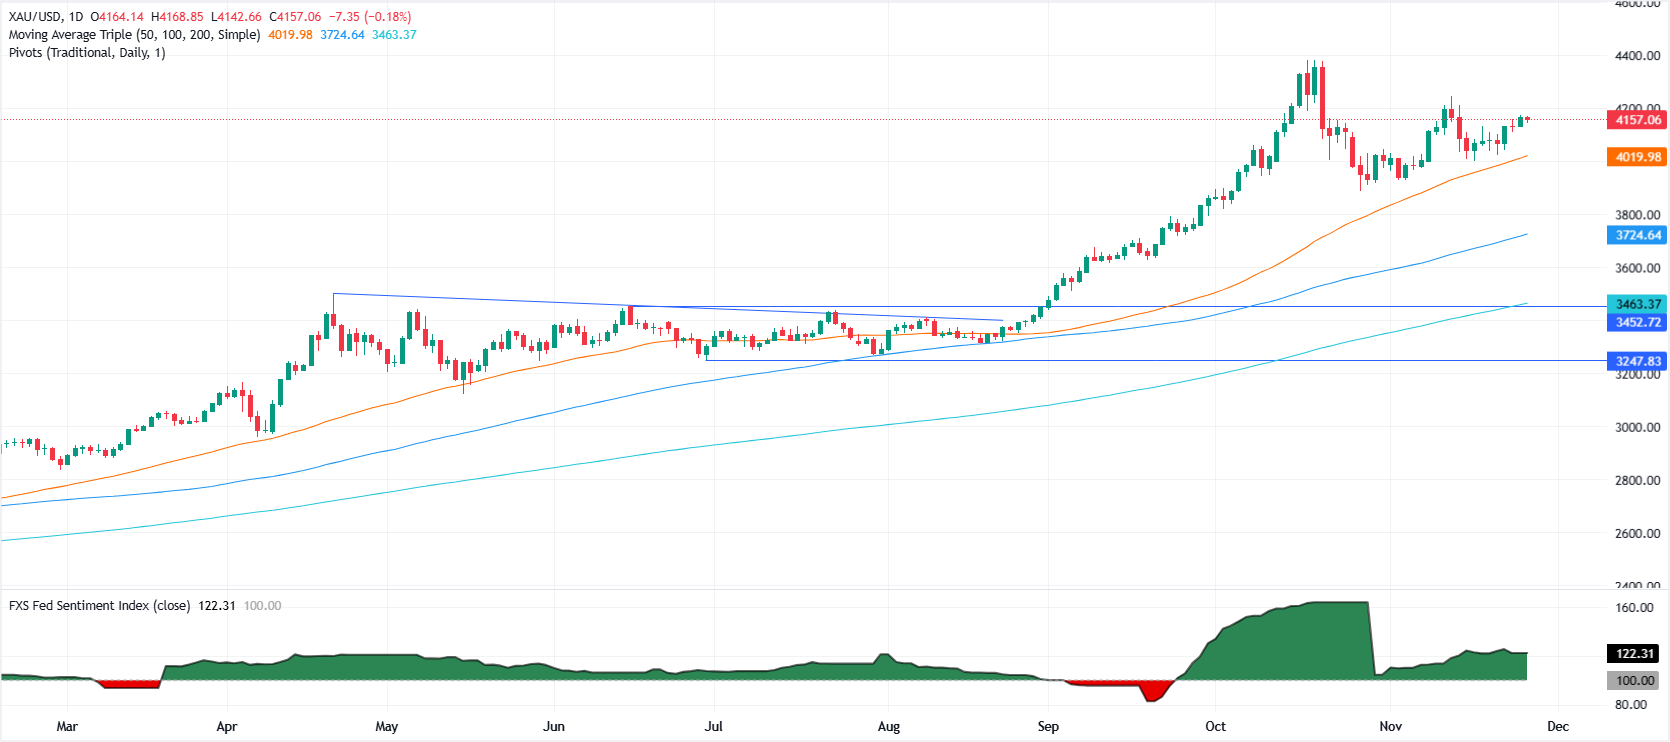
Technical analysis: Gold price consolidates around $4,150
Gold sits at around $4,160, with traders unable to challenge the $4,200 milestone even though the Relative Strength Index (RSI) is bullish, showing that buyers are in charge. A breach of the $4,200 mark would expose key resistance levels like $4,250, $4,300 and the all-time high of $4,381.
Conversely, the bulls' failure to hold firm at $4,150 and $4,100 clears the path to test the 20-day Simple Moving Average (SMA) at $4,074 and the $4,000 mark.
Gold FAQs
Gold has played a key role in human’s history as it has been widely used as a store of value and medium of exchange. Currently, apart from its shine and usage for jewelry, the precious metal is widely seen as a safe-haven asset, meaning that it is considered a good investment during turbulent times. Gold is also widely seen as a hedge against inflation and against depreciating currencies as it doesn’t rely on any specific issuer or government.
Central banks are the biggest Gold holders. In their aim to support their currencies in turbulent times, central banks tend to diversify their reserves and buy Gold to improve the perceived strength of the economy and the currency. High Gold reserves can be a source of trust for a country’s solvency. Central banks added 1,136 tonnes of Gold worth around $70 billion to their reserves in 2022, according to data from the World Gold Council. This is the highest yearly purchase since records began. Central banks from emerging economies such as China, India and Turkey are quickly increasing their Gold reserves.
Gold has an inverse correlation with the US Dollar and US Treasuries, which are both major reserve and safe-haven assets. When the Dollar depreciates, Gold tends to rise, enabling investors and central banks to diversify their assets in turbulent times. Gold is also inversely correlated with risk assets. A rally in the stock market tends to weaken Gold price, while sell-offs in riskier markets tend to favor the precious metal.
The price can move due to a wide range of factors. Geopolitical instability or fears of a deep recession can quickly make Gold price escalate due to its safe-haven status. As a yield-less asset, Gold tends to rise with lower interest rates, while higher cost of money usually weighs down on the yellow metal. Still, most moves depend on how the US Dollar (USD) behaves as the asset is priced in dollars (XAU/USD). A strong Dollar tends to keep the price of Gold controlled, whereas a weaker Dollar is likely to push Gold prices up.
Nothing in this material constitutes investment advice, personal recommendation, investment research, an offer, or a solicitation to buy or sell any financial instrument. The content has been prepared without consideration of your individual investment objectives, financial situation, or needs, and should not be treated as such.
Past performance is not a reliable indicator of future performance and/or results. Forward-looking scenarios or forecasts are not a guarantee of future performance. Actual results may differ materially from those anticipated.
Mitrade makes no representation or warranty as to the accuracy or completeness of the information provided and accepts no liability for any loss arising from reliance on such information.
Recommended Articles


