

Gold rises to three-week high as US tariffs, Iran tensions unsettle markets
- Gold climbs to a three-week high near $5,150 on renewed safe-haven demand.
- US tariff escalation and rising US-Iran tensions lift geopolitical risk premium.
- Technical momentum strengthens after a decisive break above $5,100.
Gold (XAU/USD) jumps to a three-week high on Monday as fresh uncertainty over United States (US) trade policy and escalating tensions between the US and Iran boost safe-haven demand. At the time of writing, XAU/USD is trading around $5,150, up nearly 1.0% on the day.
US Supreme Court ruling triggers fresh tariff escalation
On Friday, the US Supreme Court ruled against President Donald Trump’s use of the International Emergency Economic Powers Act (IEEPA) to impose sweeping reciprocal tariffs.
Following the ruling, the Trump administration invoked Section 122 of the Trade Act of 1974, announcing a temporary 10% flat tariff on imports from all countries, which was raised to 15% on Saturday. The duty will take effect on February 24 and can remain in force for 150 days without Congressional approval.
The move revived global trade uncertainty and amplified concerns about US fiscal and policy credibility, prompting investors to diversify into Gold while trimming exposure to US assets.
US-Iran tensions escalate amid military buildup
Meanwhile, uncertainty surrounding US-Iran nuclear talks continues to keep markets on edge, with reports of a large US military buildup in the Middle East raising fears of potential action against Iran. Negotiations are scheduled to resume in Geneva on Thursday.
Iran has indicated it is willing to make concessions on its nuclear program in exchange for sanctions relief and recognition of its right to enrich uranium, aiming to avoid further escalation.
These developments keep geopolitical risk premiums elevated, helping the precious metal extend its recovery. However, stronger follow-through could emerge once Chinese markets return on Tuesday after the Lunar New Year holiday.
Light US data calendar keeps focus on geopolitical risks
On the data front, the US economic calendar is relatively light this week, leaving Gold sensitive to trade and war-related headlines. Key releases include the four-week average for the ADP Employment Change and the Conference Board Consumer Confidence on Tuesday, followed by President Donald Trump’s State of the Union address on Wednesday, weekly Jobless Claims on Thursday, and the January Producer Price Index (PPI) on Friday.
Last week’s US data showed slower Gross Domestic Product (GDP) growth alongside firm Personal Consumption Expenditures (PCE) inflation, reinforcing the view that the Federal Reserve (Fed) will remain patient before resuming interest rate cuts. Still, traders expect a total of 50 bps of easing by the end of the year, which could provide longer-term support for Gold.
Technical analysis: XAU/USD extends breakout above $5,100
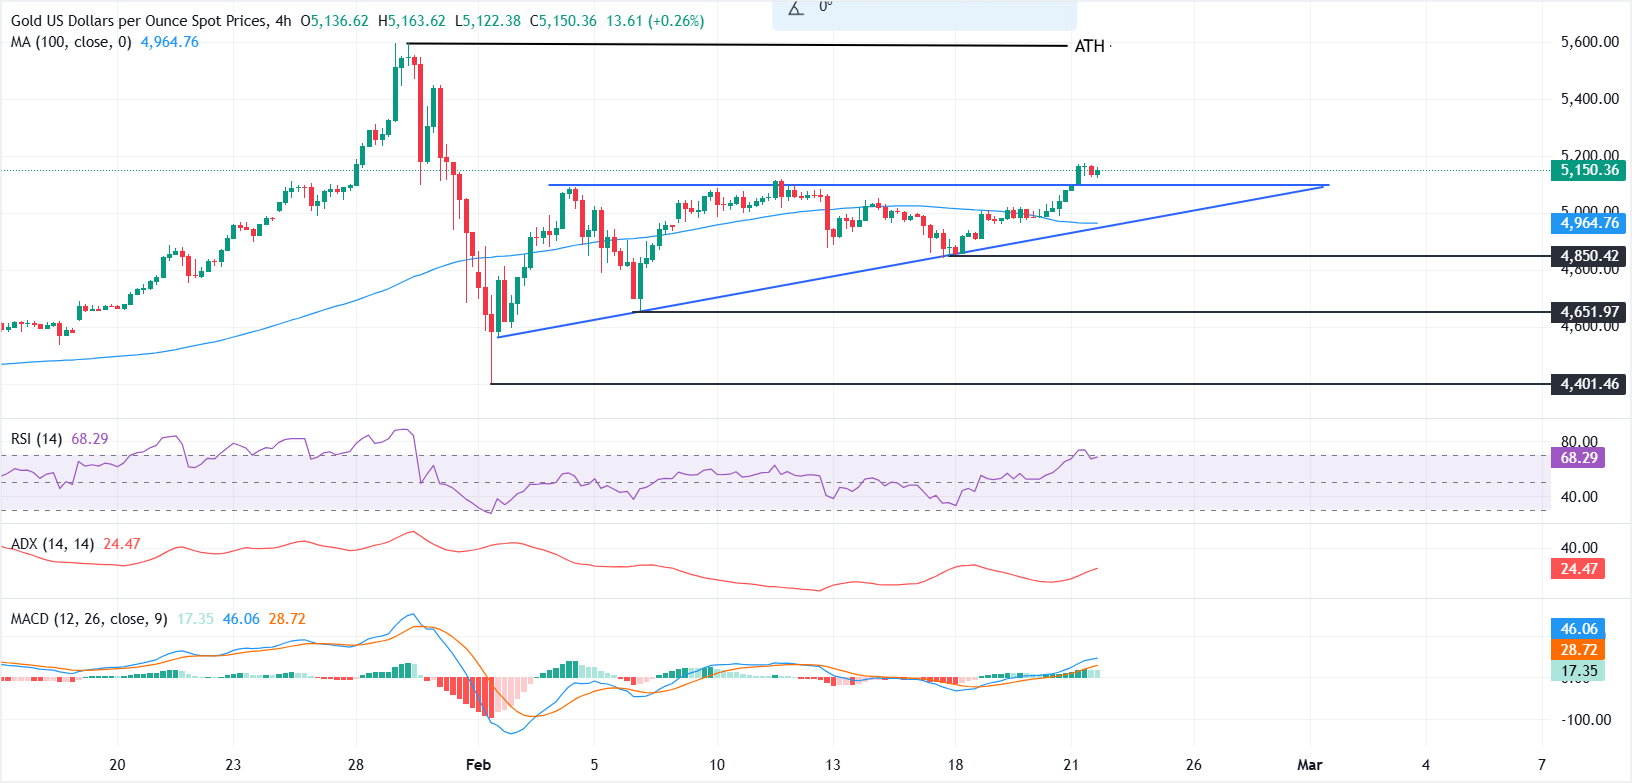
From a technical perspective, Gold’s near-term outlook has improved after a decisive break above the $5,100 resistance level, which also marked the upper boundary of a symmetrical triangle pattern on the 4-hour chart.
The breakout suggests bullish momentum is building, although it lacks strong conviction. The Relative Strength Index (RSI) is hovering near 69, close to overbought territory, while the Moving Average Convergence Divergence (MACD) histogram remains in positive territory but has begun to contract.
A sustained move above $5,200 would strengthen the bullish case and target the $5,400-$5,500 area. Conversely, a drop back below $5,100 may shift focus to the 100-period SMA at $4,964, with deeper support at $4,850 and $4,650.
Gold FAQs
Gold has played a key role in human’s history as it has been widely used as a store of value and medium of exchange. Currently, apart from its shine and usage for jewelry, the precious metal is widely seen as a safe-haven asset, meaning that it is considered a good investment during turbulent times. Gold is also widely seen as a hedge against inflation and against depreciating currencies as it doesn’t rely on any specific issuer or government.
Central banks are the biggest Gold holders. In their aim to support their currencies in turbulent times, central banks tend to diversify their reserves and buy Gold to improve the perceived strength of the economy and the currency. High Gold reserves can be a source of trust for a country’s solvency. Central banks added 1,136 tonnes of Gold worth around $70 billion to their reserves in 2022, according to data from the World Gold Council. This is the highest yearly purchase since records began. Central banks from emerging economies such as China, India and Turkey are quickly increasing their Gold reserves.
Gold has an inverse correlation with the US Dollar and US Treasuries, which are both major reserve and safe-haven assets. When the Dollar depreciates, Gold tends to rise, enabling investors and central banks to diversify their assets in turbulent times. Gold is also inversely correlated with risk assets. A rally in the stock market tends to weaken Gold price, while sell-offs in riskier markets tend to favor the precious metal.
The price can move due to a wide range of factors. Geopolitical instability or fears of a deep recession can quickly make Gold price escalate due to its safe-haven status. As a yield-less asset, Gold tends to rise with lower interest rates, while higher cost of money usually weighs down on the yellow metal. Still, most moves depend on how the US Dollar (USD) behaves as the asset is priced in dollars (XAU/USD). A strong Dollar tends to keep the price of Gold controlled, whereas a weaker Dollar is likely to push Gold prices up.
Nothing in this material constitutes investment advice, personal recommendation, investment research, an offer, or a solicitation to buy or sell any financial instrument. The content has been prepared without consideration of your individual investment objectives, financial situation, or needs, and should not be treated as such.
Past performance is not a reliable indicator of future performance and/or results. Forward-looking scenarios or forecasts are not a guarantee of future performance. Actual results may differ materially from those anticipated.
Mitrade makes no representation or warranty as to the accuracy or completeness of the information provided and accepts no liability for any loss arising from reliance on such information.
Recommended Articles


