

Gold Plunges $200, Is This the Start of a Decline? Or a Buying Opportunity?
TradingKey - Today's gold ( XAUUSD) price action logic in a nutshell: safe-haven sentiment remains in play, but higher interest rates and a stronger dollar are weighing gold prices down.
As of press time, spot gold fell to $4,804.25 per ounce, marking a new low since February 17.
At its latest meeting, the Federal Reserve kept interest rates unchanged and offered few clear hints regarding future rate cuts, merely maintaining the expectation of one more cut this year. Meanwhile, the U.S. Dollar Index strengthened to 100.31, and 10-year Treasury yields also rose, all of which are dampening gold's appeal.
Fundamentals
From a fundamental perspective, tensions in the Middle East have not cooled, the conflict involving Iran continues to escalate, and oil prices remain high. The market is concerned that energy costs will continue to feed into inflation, which explains the Fed's cautious stance. The issue is that as inflationary pressures rise, market expectations for a "quick rate cut" are pushed back, which in turn is bearish for gold and drives prices lower.
Simultaneously, U.S. February PPI was also unexpectedly higher than forecast, further reinforcing the judgment that "interest rates may stay higher for longer." In other words, gold isn't lacking safe-haven buying; it's simply that the variables of interest rates and the dollar currently hold the upper hand.
Technical Analysis
From a technical standpoint, gold is currently still in a high-level consolidation phase. Prices failed to break through the resistance near $5,420 during an upward move and now appear to be undergoing a relatively deep corrective pullback.
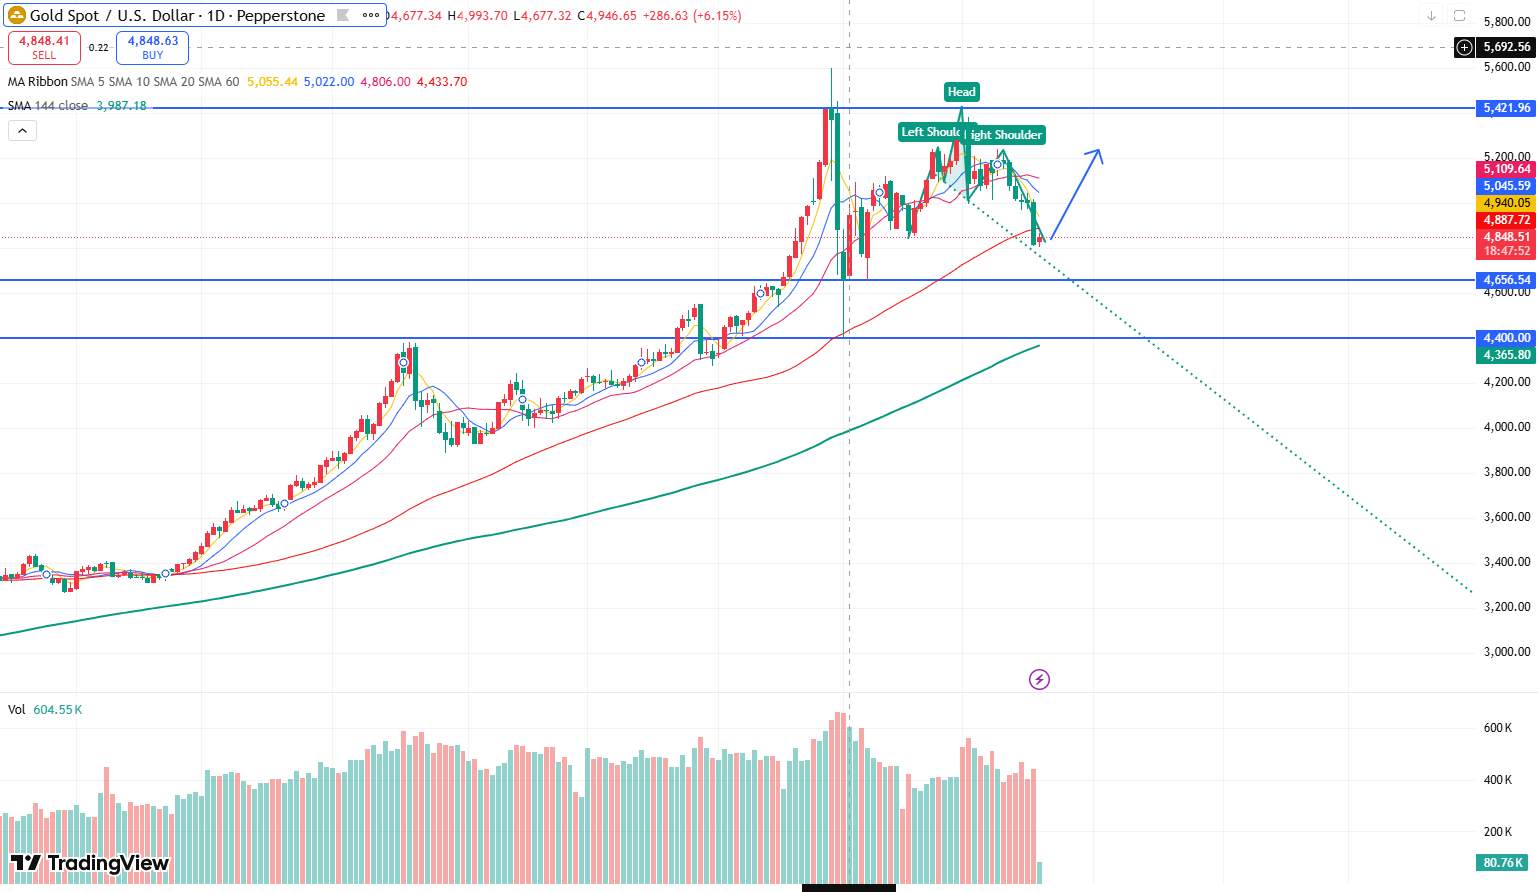
Source: TradingView
Gold's daily chart shows that the price decline projected by the head-and-shoulders top pattern has been completed, and the February 17 low has been successfully broken. Looking ahead, gold is likely to maintain a range-bound trend, testing the $5,118 resistance level. A break above this level would open up the upside toward the $5,420 resistance mark.
However, it is worth noting that if gold continues to slide and breaks below the $4,800 mark, prices may further test the $4,650-$4,400 range and find support within that zone.
The current market dynamic is quite typical: gold prices tend to be suppressed whenever news leans hawkish, but safe-haven rebounds quickly emerge as long as geopolitical risks escalate. Therefore, for short-term trading, long positions can use 4,800 as a defensive level. For immediate resistance above, watch the 10-period and 20-period SMAs on the 4-hour chart, with further resistance at the $5,000 mark.
Nothing in this material constitutes investment advice, personal recommendation, investment research, an offer, or a solicitation to buy or sell any financial instrument. The content has been prepared without consideration of your individual investment objectives, financial situation, or needs, and should not be treated as such.
Past performance is not a reliable indicator of future performance and/or results. Forward-looking scenarios or forecasts are not a guarantee of future performance. Actual results may differ materially from those anticipated.
Mitrade makes no representation or warranty as to the accuracy or completeness of the information provided and accepts no liability for any loss arising from reliance on such information.
Recommended Articles


