

Gold stalls near $4,400 as Oil, US yields, war risks cap upside
- Gold holds near $4,400 as Middle East war keeps safe-haven demand alive.
- Rising Oil, firmer DXY and higher Treasury yields continue to limit bullion’s rebound.
- Markets price no Fed cuts in 2026 as inflation risks tied to the war remain elevated.
Gold (XAU/USD) remains pressured on Tuesday, remaining near its opening price amid heightened tensions in the Middle East, as the Wall Street Journal reported that the Pentagon plans to deploy a brigade combat team from the Army's elite Airborne Division. The XAU/USD pair trades at $4,404, after hitting a daily low of $4,306.
Bullion struggles for direction as rising energy prices and firm US yields offset persistent geopolitical tension
Geopolitics remain in the driver's seat in financial markets, amid worries that hostilities would resume if the US and Iran talks fail to provide an agreement in four days. Meanwhile, high energy prices have prompted investors to trim bets on the Federal Reserve's (Fed) dovish stance, as the war in Iran is about to enter its fifth week and has disrupted shipments of about one-fifth of the world's Oil and natural gas through the Strait of Hormuz.
As of writing, Oil prices are rising, with West Texas Intermediate (WTI) up more than 3% to $91.65. The Greenback, which has remained positively correlated with WTI over the last two weeks, is gaining 0.34%, according to the US Dollar Index (DXY).
The DXY, which measures the performance of the buck versus six currencies, trades at 99.50 after bouncing off daily lows of 99.09.
Recently, Axios revealed that the US and a group of regional mediators are discussing hosting high-level peace talks with Iran as soon as Thursday. Still, they're waiting for Iran's response.
Business activity in the US slowed, according to S&P Global's March Flash PMIs. The S&P Global Services PMI slowed from 51.7 to 51.1 while the services index improved from 51.6 to 52.4. Finally, the S&P Global Composite PMI for March, which comprises both indices, dipped from 51.9 in February to 51.4 in the current month.
Earlier, US jobs data from Automatic Data Processing (ADP) showed its 4-week Employment Change average improved from 9K to 10K.
Fed to hold rates in 2026
Money markets do not expect any rate cuts by the Federal Reserve this year, following last week's meeting. Uncertainty about the duration of the US-Israel and Iran conflict has increased the US Dollar's safe-haven appeal, a headwind for bullion prices.
The swaps market had priced in a 14% chance of a rate hike at the FOMC's April meeting. US Treasury yields are rising, with the 10-year T-note up nearly five and a half basis points at 4.408%.
US jobs data, Fed speeches ahead on the US economic calendar
On Wednesday, the US economic docket is light, aside from Fed Governor Stephen Miran's speech. By Thursday, US jobs data would be released, followed by speeches by Fed officials Cook, Miran, Jefferson and Barr.
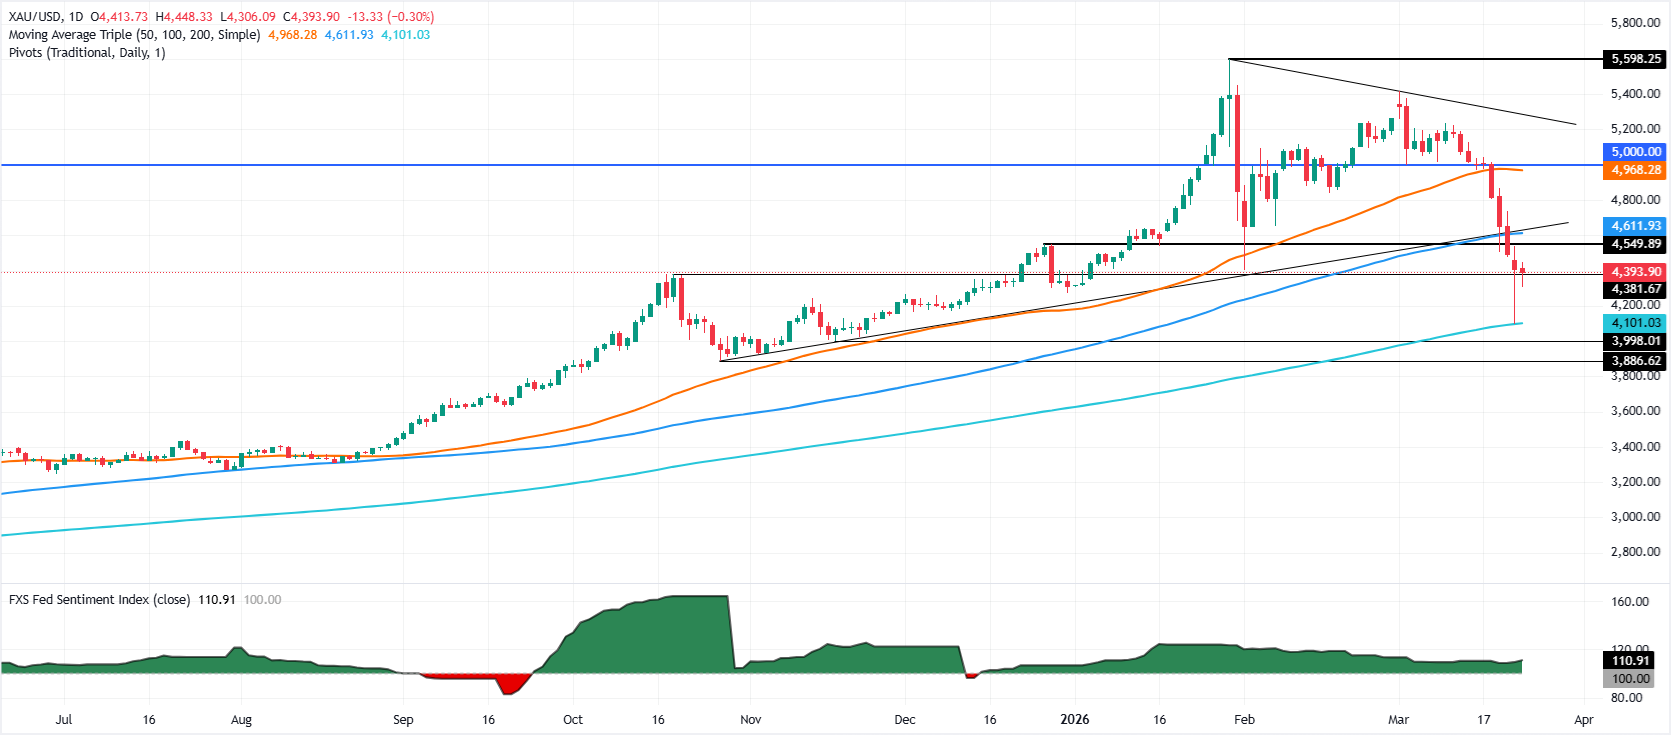
XAU/USD technical outlook: Gold to remain sideways as doji emerges
Gold's technical picture remains bullish, as Monday's price action formed a hammer and the yellow metal hit a daily low of $4,098, shy of the 200-day Simple Moving Average (SMA) at $4,077.
As of writing, price action remains sideways, poised to form a doji candle, indicating traders' indecision.
The Relative Strength Index (RSI) is oversold; the slope has turned flat, an indication that sellers remain in charge.
For a bullish continuation, XAU/USD must clear the Monday daily high at $4,536, ahead of the 100-day SMA at $4,590. A breach of the latter will expose the March 20 high of $4,736 ahead of the 50-day SMA at $4,960.
On the downside, a Gold daily close below the February 2 cycle low of $4,402 would exacerbate a test of the November 13 high, which has turned support at $4,245, ahead of the 200-day SMA at $4,077.
Gold FAQs
Gold has played a key role in human’s history as it has been widely used as a store of value and medium of exchange. Currently, apart from its shine and usage for jewelry, the precious metal is widely seen as a safe-haven asset, meaning that it is considered a good investment during turbulent times. Gold is also widely seen as a hedge against inflation and against depreciating currencies as it doesn’t rely on any specific issuer or government.
Central banks are the biggest Gold holders. In their aim to support their currencies in turbulent times, central banks tend to diversify their reserves and buy Gold to improve the perceived strength of the economy and the currency. High Gold reserves can be a source of trust for a country’s solvency. Central banks added 1,136 tonnes of Gold worth around $70 billion to their reserves in 2022, according to data from the World Gold Council. This is the highest yearly purchase since records began. Central banks from emerging economies such as China, India and Turkey are quickly increasing their Gold reserves.
Gold has an inverse correlation with the US Dollar and US Treasuries, which are both major reserve and safe-haven assets. When the Dollar depreciates, Gold tends to rise, enabling investors and central banks to diversify their assets in turbulent times. Gold is also inversely correlated with risk assets. A rally in the stock market tends to weaken Gold price, while sell-offs in riskier markets tend to favor the precious metal.
The price can move due to a wide range of factors. Geopolitical instability or fears of a deep recession can quickly make Gold price escalate due to its safe-haven status. As a yield-less asset, Gold tends to rise with lower interest rates, while higher cost of money usually weighs down on the yellow metal. Still, most moves depend on how the US Dollar (USD) behaves as the asset is priced in dollars (XAU/USD). A strong Dollar tends to keep the price of Gold controlled, whereas a weaker Dollar is likely to push Gold prices up.
Nothing in this material constitutes investment advice, personal recommendation, investment research, an offer, or a solicitation to buy or sell any financial instrument. The content has been prepared without consideration of your individual investment objectives, financial situation, or needs, and should not be treated as such.
Past performance is not a reliable indicator of future performance and/or results. Forward-looking scenarios or forecasts are not a guarantee of future performance. Actual results may differ materially from those anticipated.
Mitrade makes no representation or warranty as to the accuracy or completeness of the information provided and accepts no liability for any loss arising from reliance on such information.
Recommended Articles


