



Gold Price Falls Below $4,400. Drops Nearly $200 for Three Consecutive Days, Decline May End
TradingKey - During the Asian session on May 28, gold prices ( XAUUSD) extended their downward trend, breaking below the $4,400 level intraday and hitting a session low of $4,366.29. After falling nearly $200 over three consecutive trading days, technical indicators show that the price has reached a key support level near $4,360, suggesting the downward momentum may be coming to an end.
Recurring US-Iran tensions coupled with PCE data: Gold prices face a directional choice.
From a fundamental perspective, the primary factor influencing gold's trajectory recently remains the uncertainty surrounding the U.S.-Iran situation.
Previously, Trump commented on the U.S.-Iran situation, stating that a deal with Iran is largely finalized and may include the reopening of the Strait of Hormuz, though final details still require confirmation. The U.S. has also signaled that an agreement could be completed within days, with key components including the reopening of the Strait of Hormuz, the lifting of the U.S. naval blockade, and phased arrangements regarding the Iranian nuclear issue.
However, the latest statements indicate that the U.S. has not lowered its negotiation threshold. During a cabinet meeting on May 27, Trump accused Iran of attempting to delay negotiations to secure more favorable terms after the U.S. midterm elections, highlighting the pressure on Iran's economy. The White House also denied Iranian media reports of a draft agreement involving U.S. troop withdrawals and the lifting of blockades, calling them "completely fabricated."
Iran stated that it has not reached an agreement with the U.S. regarding the Strait of Hormuz. According to Iranian media reports on the 27th, Ali Bagheri, Deputy Secretary of Iran's Supreme National Security Council, stated that Iran and the U.S. have yet to agree on issues related to the Strait, and that the issue of uranium enrichment is not currently on the negotiation agenda. Following the official's remarks, gold prices plummeted more than $40 in the short term.
Notably, the U.S. April PCE data to be released today will be a major variable affecting short-term gold price movements. According to the latest market expectations, April PCE inflationary pressure is likely to remain high. Barron's reported that the market expects headline PCE to rise 0.5% month-over-month and 3.9% year-over-year, potentially reaching its highest level since May 2023; core PCE is expected to rise slightly to 3.3% year-over-year.
Against the backdrop of current U.S.-Iran tensions, the importance of the PCE data has further increased. Recent oil prices have been significantly impacted by the Middle East situation, with market concerns that energy prices could drive inflation higher again through gasoline, transportation, and corporate costs. If the PCE confirms an energy-driven inflation rebound, gold prices may face greater downward pressure; if it shows core inflation is relatively contained, it will support a recovery in gold prices.
Gold Price Technical Analysis: 4360 Becomes the Make-or-Break Level for Bulls
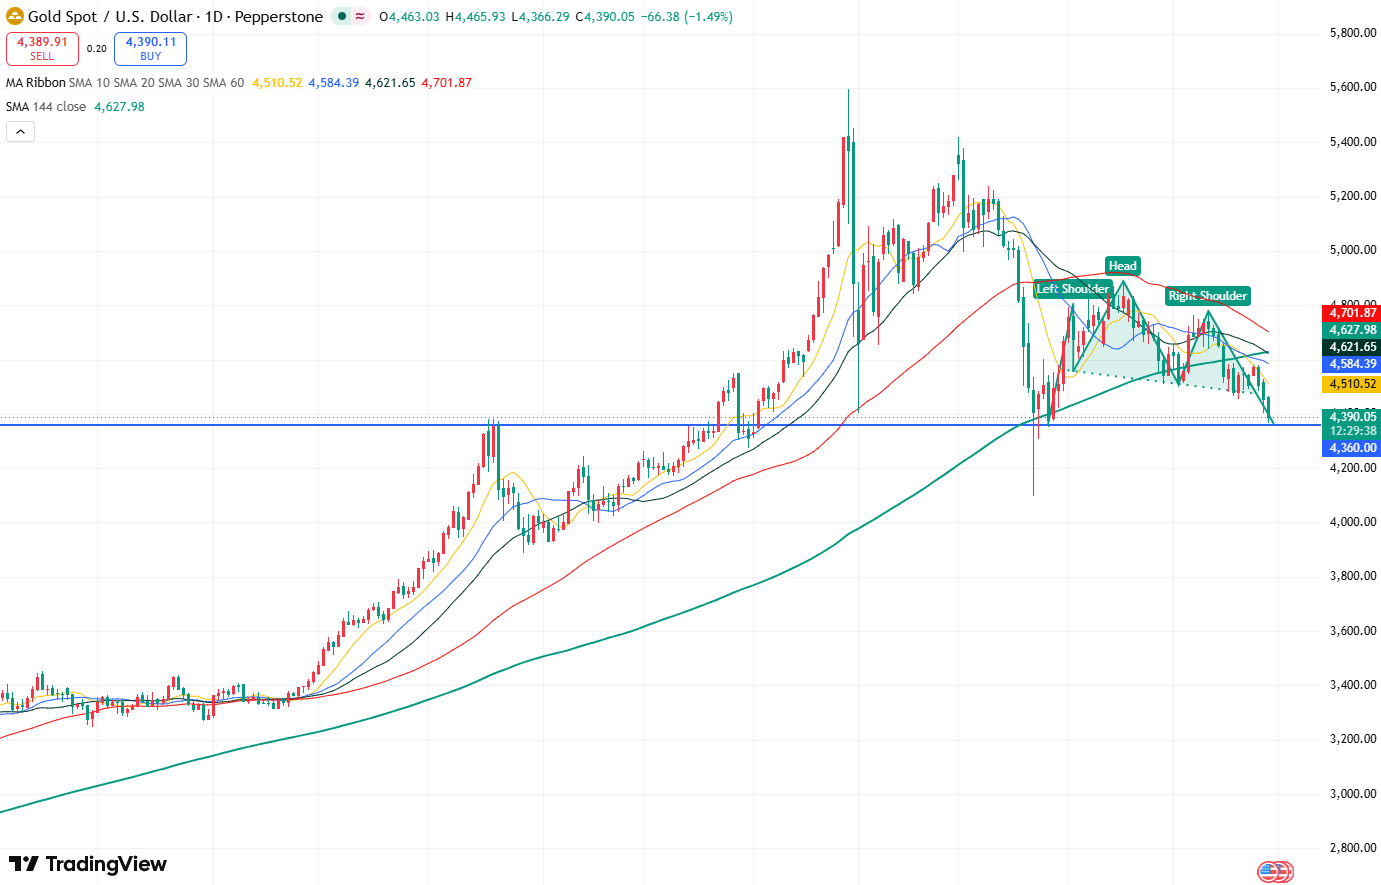
Gold Price Daily Chart, Source: TradingView
Based on the daily chart, gold prices hit a low of $4,366.29 today, nearing the key support level of $4,360, which is the primary bearish target of the head-and-shoulders top formation. This indicates that the structure is nearing completion; while there remains room for further downside in the short term, bearish momentum is gradually dissipating, and the likelihood of a technical recovery rally is increasing.
Currently, if gold's closing price today falls below the key support level of $4,360, it will open further downside toward $4,100, with a potential test of the $4,000 psychological mark. Conversely, if gold closes and stabilizes above $4,360, a technical recovery rally may begin in the short term, with an initial target at the $4,450 resistance level followed by the $4,500 psychological mark.
Trading Recommendations
Long Entry: 4350
Stop Loss: 4302
Take Profit: 4445
Short Entry: 4395
Stop Loss: 4420
Take Profit: 4310
Nothing in this material constitutes investment advice, personal recommendation, investment research, an offer, or a solicitation to buy or sell any financial instrument. The content has been prepared without consideration of your individual investment objectives, financial situation, or needs, and should not be treated as such.
Past performance is not a reliable indicator of future performance and/or results. Forward-looking scenarios or forecasts are not a guarantee of future performance. Actual results may differ materially from those anticipated.
Mitrade makes no representation or warranty as to the accuracy or completeness of the information provided and accepts no liability for any loss arising from reliance on such information.
Recommended Articles


